Analyse Cash Flow Projections Using Scenarios in TallyPrime
In TallyPrime, you can create new scenarios and alter existing ones to analyse financial reports based on your reporting requirements. You can record transactions for different scenarios in TallyPrime and compare the corresponding report details to understand their impact and outcomes.
For example, let’s create a Scenario for Optional Payments and compare it with your actual figures to analyse the variance.
Create Scenarios

- Press Alt+G (Go To) > Create Master > Scenario.
- Enter a scenario Name, for example, Optional Payment.
- Ensure Include actuals is set to Yes.
This ensures that both actual and scenario-based transactions are reflected in your financial reports. - Select the voucher types to Include.
Transactions recorded using the selected voucher types will be included for comparison but will not affect your financial reports. - Select the voucher types to Exclude.
This option allows you to exclude specific voucher types selected under Include so that their transactions are not reflected in your financial reports. - Press Ctrl+A to save.
You can alter the Scenarios whenever your business requirements change, and delete them when they are no longer needed.
Record Transactions for Scenarios
If you have Optional vouchers, Memorandum vouchers, or Reversing Journals for your business transactions, then Scenarios can help you assess the impact of such transactions without impacting your books of accounts.
Use scenarios in reports such as the Balance Sheet to compare actual figures with the transactions by adding a new column and selecting the required scenario.
Compare Report Details Using Scenarios
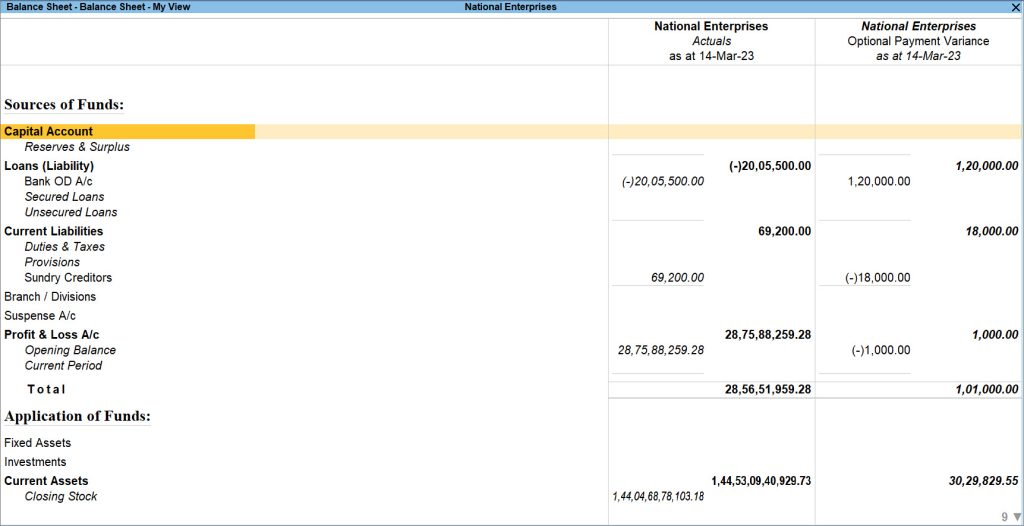
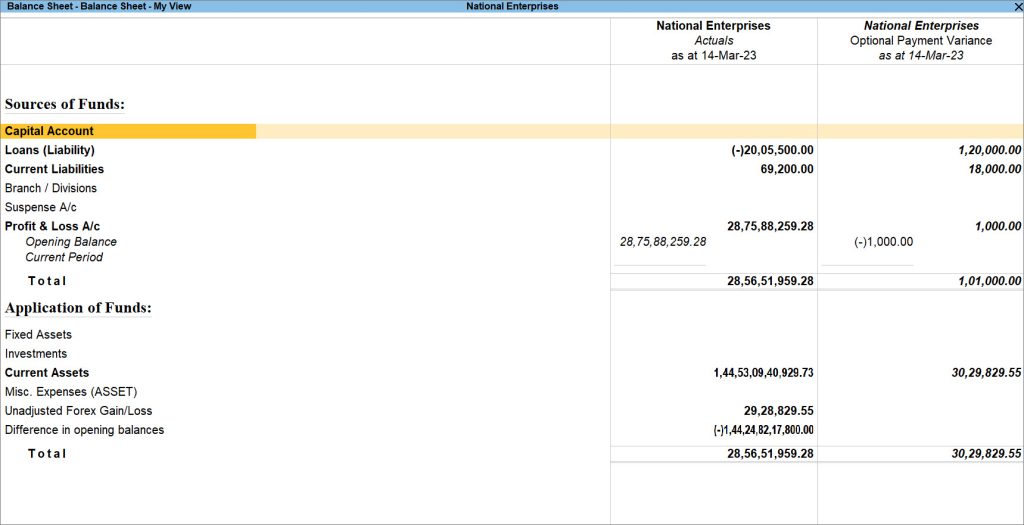
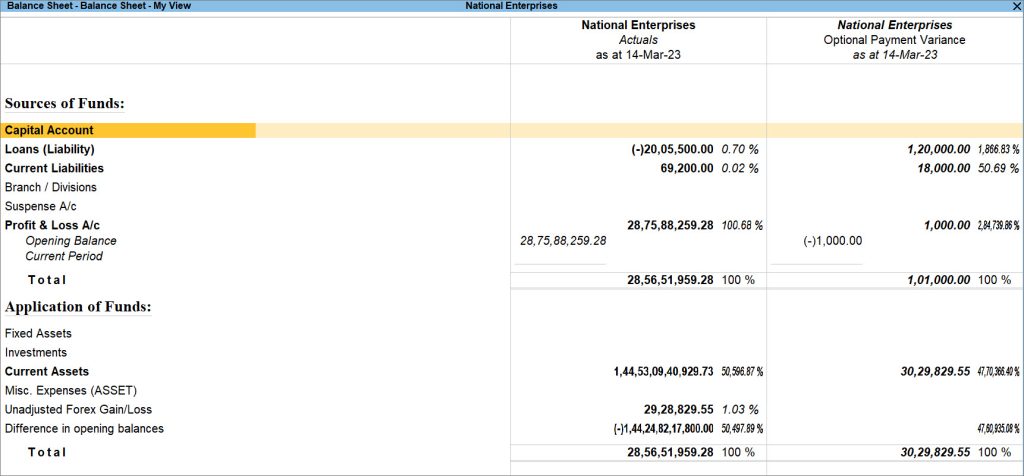
Now, let’s look at the variance between the actuals and the optional payment to get a more realistic view of your financial position.
- Open any report, say Balance Sheet, and press Alt+C (New Column).
- In the Select Column Details screen, view the variance between the actuals and the scenario.
- Type of value to show: Select the scenario you had created for Optional Payment.
- Show Variance: Select Yes.
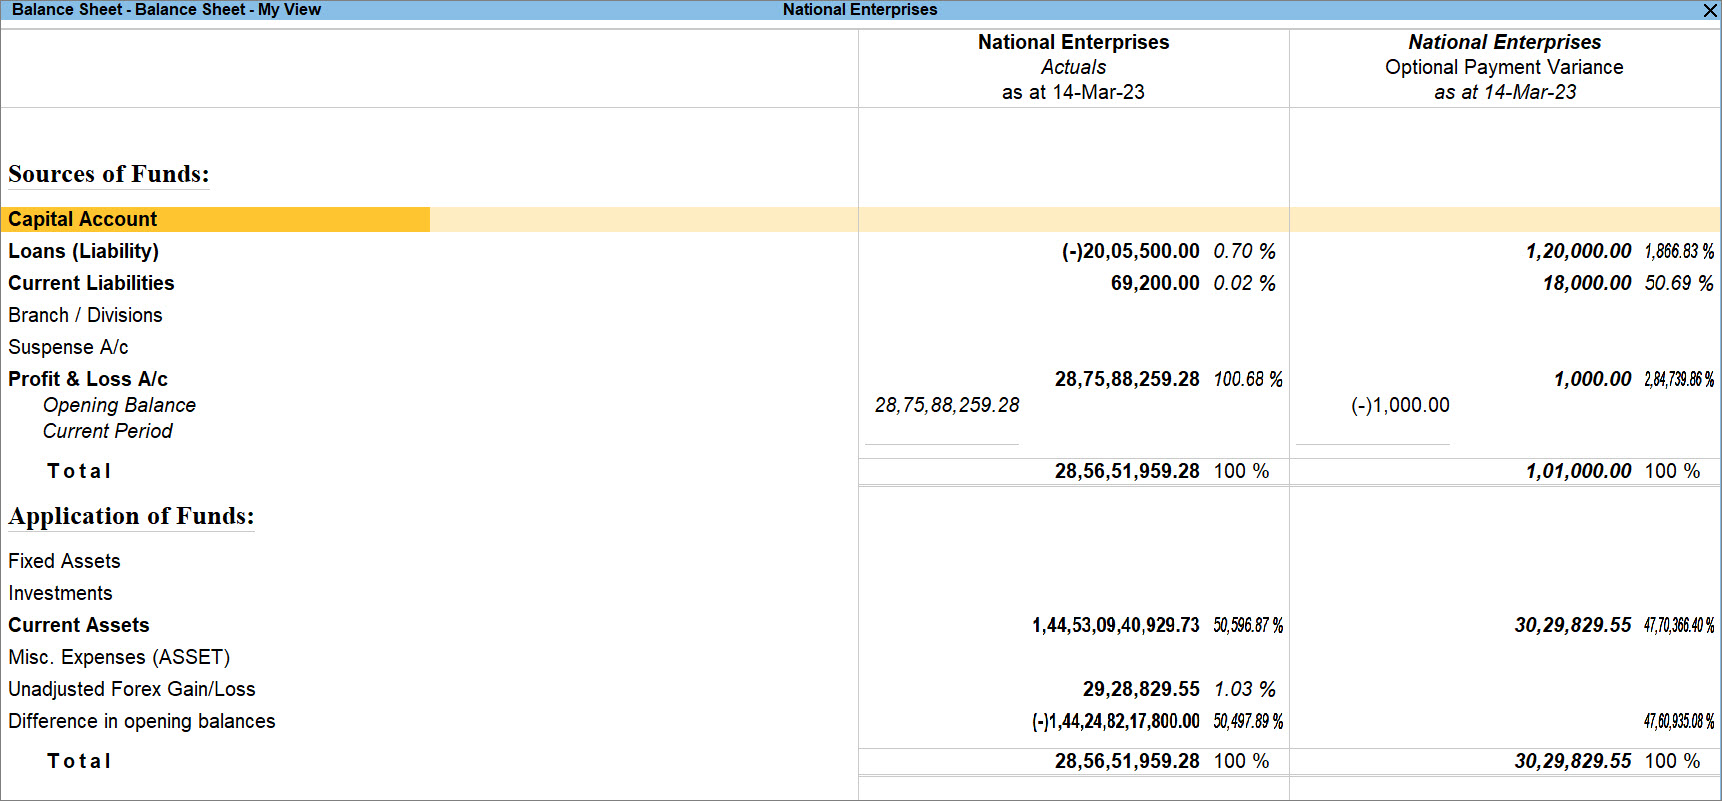
- To view each line in the report as a percentage of the total amount, press F12 (Configure) and enable Show Percentages.
You can now compare the contribution of individual line items across the Actuals and Variance columns in terms of percentage.
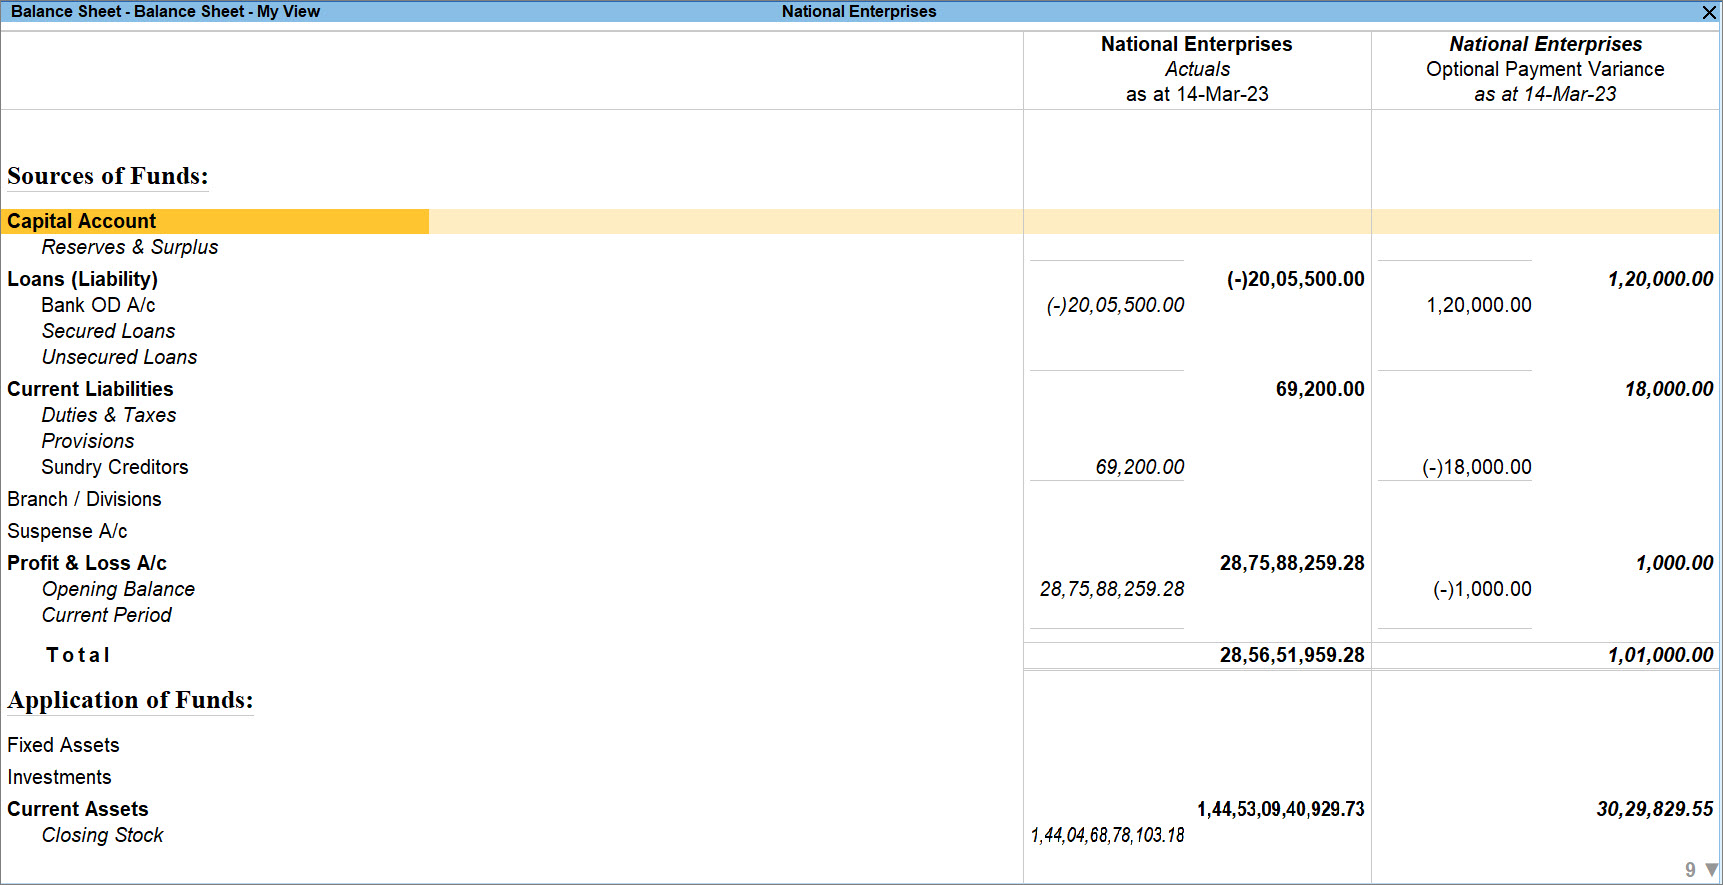
- To view the report in a Detailed view, press Alt+F5 (Detailed/Condensed) to toggle between the Detailed and Condensed view.
You can also press F12 (Configure) and set Format of Report to Detailed.