Cash Flow & Cash Flow Projection
Cash Flow refers to the movement of money in and out of a business in a particular period. Apart from helping you monitor the incoming and outgoing money in your business, the cash flow statement can also be used as a Receipt and Payment statement across any kind of business dealings. At the same time, the Cash Flow Projection report helps you forecast the incoming and outgoing of money for your business. In TallyPrime, you can view the Cash Flow Statement to summarise and view the inflow and outflow of money for a particular financial period or for a particular month.
View cash inflow and outflow using Cash Flow Summary
Through the Cash Flow statement in TallyPrime, not only you can keep view the inflow and outflow of cash during a particular period, such as sales and customer payments, but at the same time, you will be able to track your positive cash flow and negative cash flow, as well. When you have more cash coming into your business than you have leaving it, it is called positive cash flow. In TallyPrime, you can also have a detailed view of your inflow and outflow for a particular month along with your Nett Inflow, as you drill down further from your Cash Flow statement.
View Cash Flow Projection Report in TallyPrime
Unlike the Cash Flow, which highlights the already occurred flow of cash, the Cash Flow Projection is a prediction of a business’s expected cash inflows and outflows. Through the Cash Flow Projection report in TallyPrime, you can anticipate the cash to be generated or spent for a specific period in the future, such as a month, quarter, or year. This will help you to make informed decisions about various business scenarios such as resource allocation and risk management. Apart from that, you can also set the limit for your Bank Overdraft accounts through the Cash Flow Projection report in TallyPrime to monitor the cash flow according to the desired limit. As a businessman, you can use Overdraft accounts to draw money from the bank up to the set overdraft limit, apart from the balance available.
You can also view the Cash Flow Reports in the browser.
Cash Flow in TallyPrime
![]()
Cash Flow is the inflow and outflow of cash during an accounting period, that portrays how businesses manage their cash. Here, the term ‘cash’ stands for cash and bank balances. Playing a crucial role in analyzing the economic standing of a business, a cash flow statement keeps track of the amount of money that flows in and out due to business handling.
- Press Alt+G (Go To) > type or select Cash Flow > press Enter.
Alternatively, Gateway of Tally > Display More Reports > Cash Flow.
A sample image of the Cash Flow statement appears, as shown below:
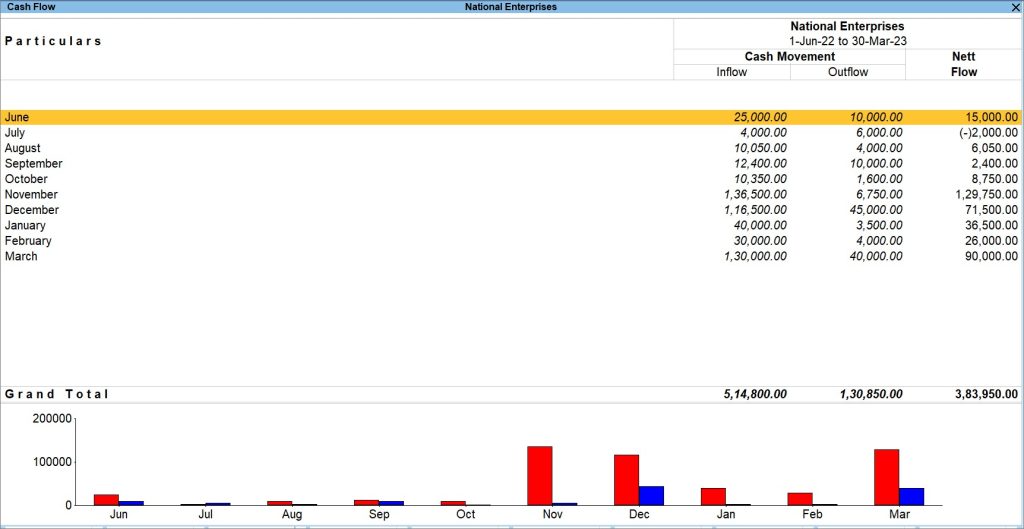
To select any period like a month, a quarter, or a year, you can press F2 (Period) and view Cash Flow for the particular period. You can select a particular month and drill down further to access Cash Flow Summary report. Going further, you will have an intrinsic idea about the overall Cash Flow along with the current assets, current liabilities, voucher types used for a particular transaction, and so on. You can have your Nett Flow in negative, if you have more cash outflow and less cash inflow for a particular month, as shown in the Cash Flow report above for the month of July.
One of the key features of the Cash Flow Report in TallyPrime is the graph that comes at the end of the Cash Flow Report. The graph represents the overall inflow and outflow of cash happened for each month, as demonstrated in the horizontal axis of the graph. The vertical axis represents the overall cash limit under which the incoming and outgoing of funds happened. Like shown in the graph above, two different colors represent inflow and outflow of money. For example, the color red here represents the inflow of money and color blue represents the outflow of money. You can click on the graph for a particular month and drill down further to access Cash Flow Summary report.
You can also customise the Cash Flow report in TallyPrime and modify the data in terms of Hundreds, Lakhs, Millions, Thousands, and so on by selecting the Scale Factor in the Basis of Value configuration. To do so,
- Press Ctrl+B (Basis of Value) > Scale Factor and select the required option.
You can also change the view of the report and add periodic columns like monthly, quarterly, weekly, and so on, for a comparative view of the cash flow across periods. To do so,
- Press Ctrl+H (Change View) and select the required period in the List of Views field.
For example, if you want to see the cash flow in your business for every quarter you can select Quarterly.
If you want to compare your cash flow, either on a weekly basis or fortnightly basis, you can configure the columns to appear quarterly, weekly, daily, fortnightly, and so on, from the Auto Repeat Columns screen. To do so,
- Press Alt+N (Auto Column) and select the required period in the Column Details field.
To know further about reports and their features in TallyPrime, go to Working with Reports in TallyPrime.
Cash Flow Projection in TallyPrime
Cash Flow Projection is an integral part of business planning. It takes into account the flow of cash and helps you anticipate the cash to be generated or spent over a period of time. TallyPrime allows you to view your Cash Flow Projection report through distinctive filters which include setting Overdraft limits of your bank, along with including Cash Account, Scenarios, and Overdues to your report. These features give you an inclusive overview of your Cash Flow Projection. Now, you can take more informed decisions such as, expanding into new markets, investing in new products, recruiting new staff, and so on.
In this section
View Cash Flow Projection report
![]()
The Cash Flow Projection Report forecasts the amount of cash that you expect to come into and flow out of your business, for a particular period.
- Press Alt+G (Go To) > type or select Cash Flow Projection > press Enter.
A sample image of Cash Flow Projection report appears, as shown below:
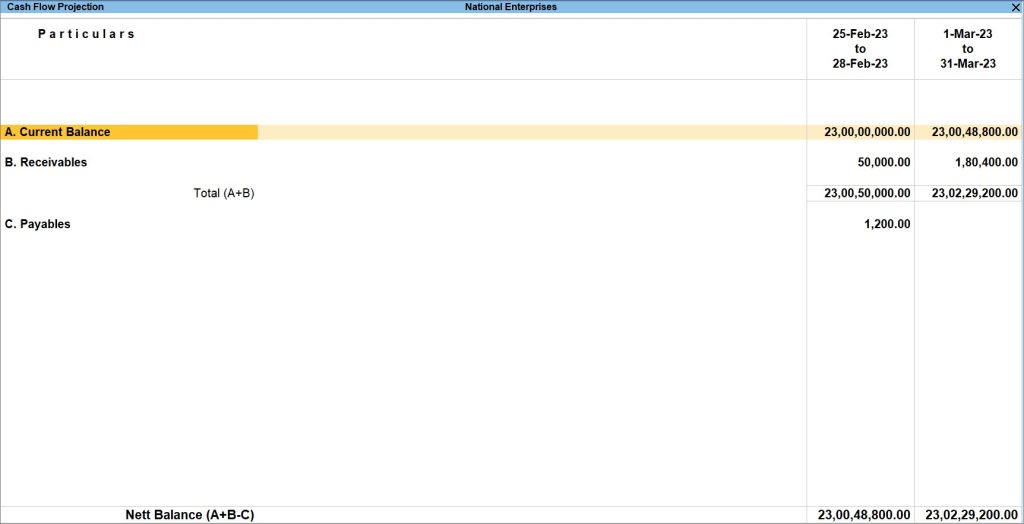
The Cash flow Projection report displays the data for the remaining days of a financial year, for which no transaction has been passed. For instance, assume that the DATE OF LAST ENTRY for your company’s financial year is 25th February, 2023, and your financial year ends by 31 March, 2023. In this case, the projection data for the remaining days of the report, which are 25th Feb, 2023 to 28th Feb, 2023, and for the month of March will be displayed. - Press Alt+N (Auto Column) to compare your data on the basis of a particular period.
In Cash Flow Projection report, the columns appear on a monthly basis, by default. If you want to compare your cash flow projection, either on a weekly basis or fortnightly basis, you can configure the columns to appear quarterly, weekly, daily, fortnightly, and so on, from the Auto Repeat Columns screen. This feature is helpful for you if you want to keep a close eye on your cash inflow and outflow.
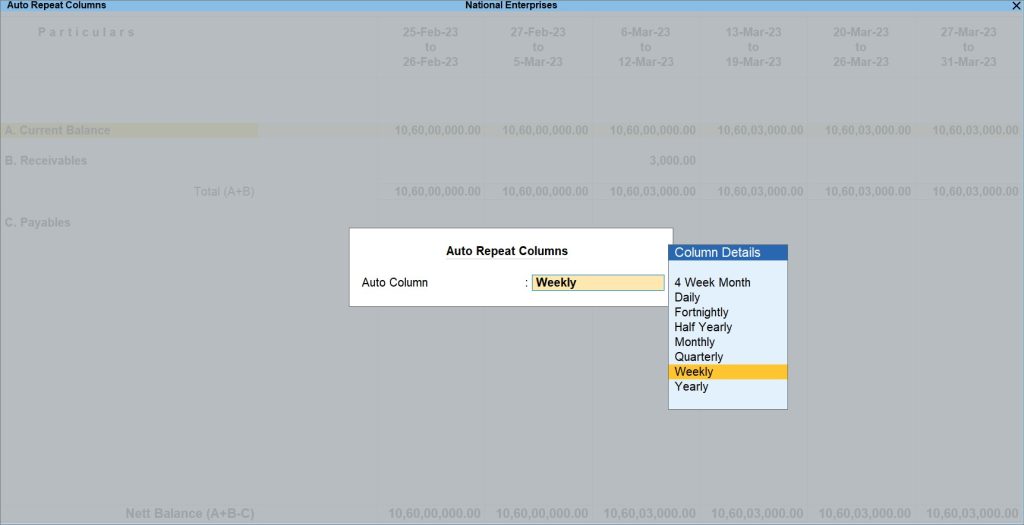
- After selecting the desired option, the Cash Flow Projection screen displays the data for the particular period.
For example, if you select weekly from the Column Details, Cash Flow Projection screen appears, as below.
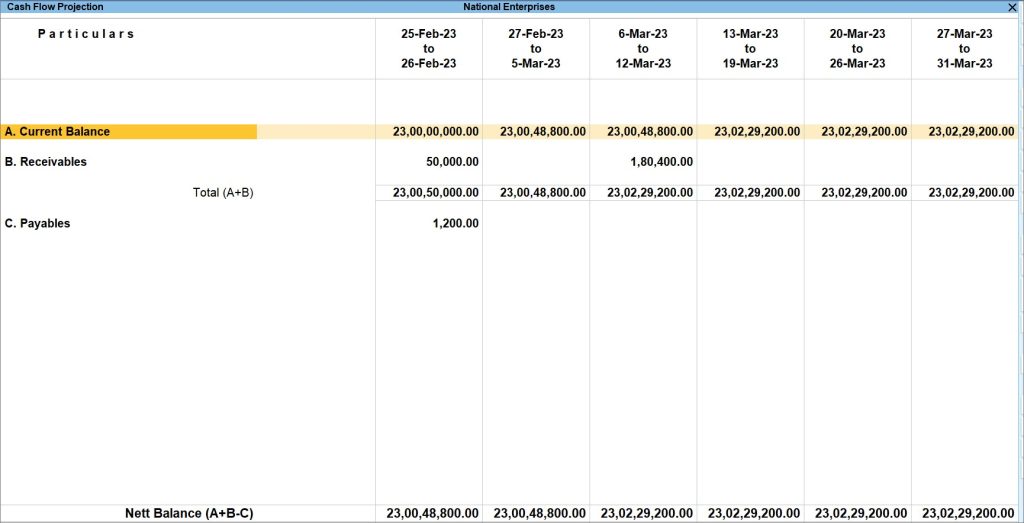
Current Balance: This row displays the projected opening balances of Cash/Bank/Bank OD accounts available for each period.
Receivables: This row displays the amounts that are receivable from customers for each period. You can drill down to view the party details, due dates, and transaction amount in the Receivable column for the periods you have chosen in the Column Details.
Payables: This row displays the amounts that are payable to suppliers for each period. Drill down to view the party details, due dates, and transaction amount in the Payables column for the periods you have chosen in the Column Details.
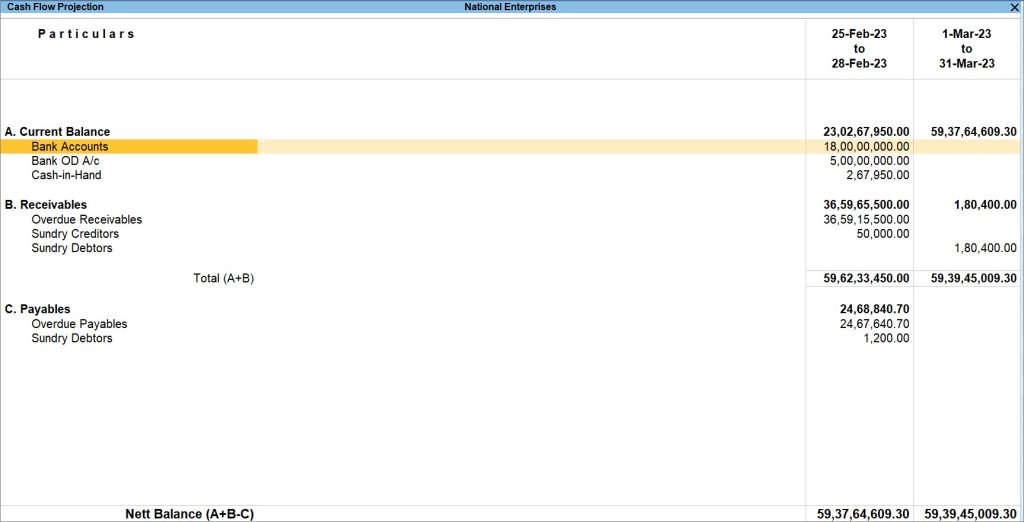
You can Press Alt+F5 to have a detailed view of the report. A sample image of Cash Flow Projection report with detailed view appears, as shown below:
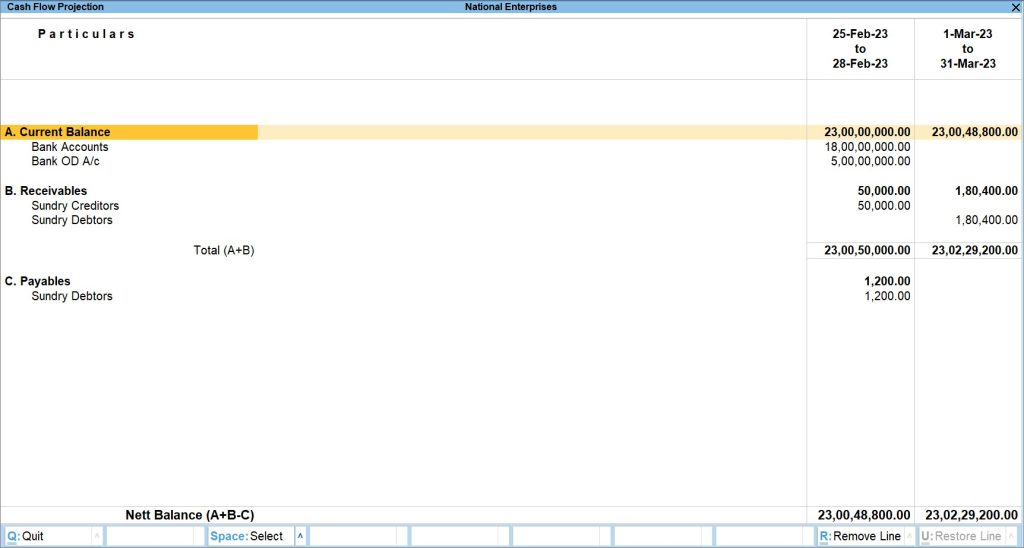
After pressing Alt+F5, you can see the rows Bank Accounts and Bank OD A/c rows appearing just below A. Current Balance section, which sum up to become the Current Balance. Similarly, Sundry Creditors and Sundry Debtors rows appear under the B. Receivables section, and Sundry Debtors row under the section C. Payables. Just like mentioned in the report below, your Nett Balance is the difference between the sum of your Current Balance and Receivables, that is (A+B) and your Payables (C).
Set Overdraft Limit
![]()
The Cash Flow Projection report in TallyPrime allows you to set the overdraft limit for your bank Overdraft accounts, so that you can project the cash flow based on the required limit. Overdraft accounts are for providing overdraft facilities to businessmen, through which they can draw more money from the bank apart from the balance available.
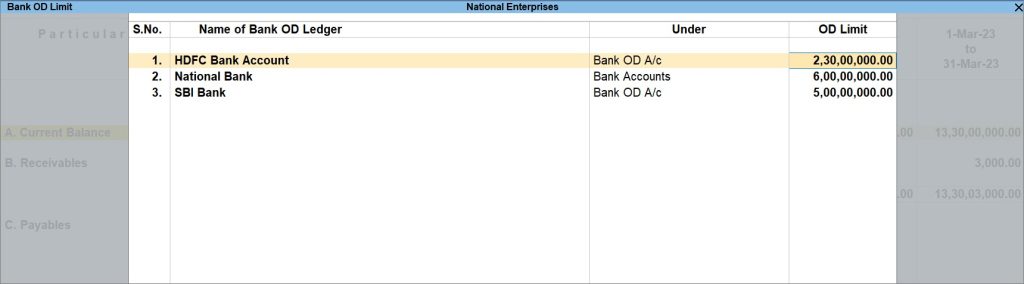
- Open Cash Flow Projection > press Alt+S (Set OD Limit). The Bank OD Limit screen appears.
- Enter the OD limits for the required banks, as shown below:
- Accept the screen. As always, press Ctrl+A to save.
The Overdraft limit specified for a bank account either excludes or includes the opening balance brought forward, depending on whether it is a credit balance or a debit balance.
You can also set OD limit from Ledger Alteration screen.
- Press Alt+G (Go To) > select Alter Master > select Ledger under Accounting Masters from Master Alteration screen.
- Select the Bank for which you want to set the OD limit from the List of Ledgers. The Ledger Alteration screen appears.
- Set the OD limit.
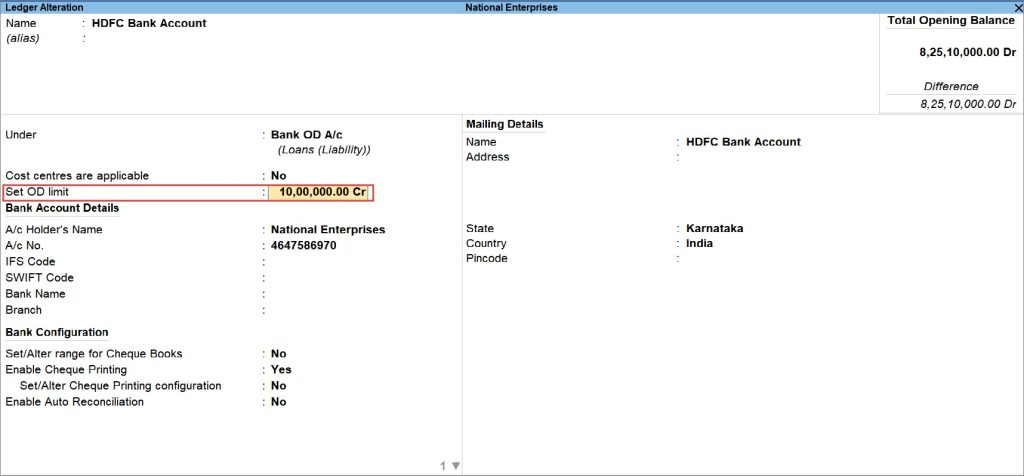
- Accept the screen. As always, press Ctrl+A to save.
The alteration of Overdraft limit from either of the screens is acceptable and is reflected automatically in the bank ledger.
Viewing Cash Flow Projection
TallyPrime allows you to have a detailed view of your Cash Flow Projection report by adding few other parameters such as Cash Account, Overdues, including the Scenarios, and so on. You have to include these parameters in the Cash Flow Projection report, by pressing Ctrl+B (Basis of Values), as they do not get reflected in the projection report by default. After enabling Cash Account, you can see your overall Cash-in-Hand under Current Balance. When you set the Include Scenarios option to Yes, you can see your entries passed using Memorandum vouchers, Reversing Journal, and Optional vouchers, getting reflected in the Cash Flow Projection report. Similarly, the Include Overdues option is for projecting your Overdue Receivables and Overdue Payables in the report.
Cash account
![]()
By default, the Cash Flow Projection displays the Bank Accounts and Bank OD A/c. Hence, payments made towards expenses and purchases through cash is not displayed. However, you can configure the Cash Flow Projection to include the cash account.
- Open Cash Flow Projection > press Ctrl+B (Basis of Values).
- Change Include Cash Account to Yes.
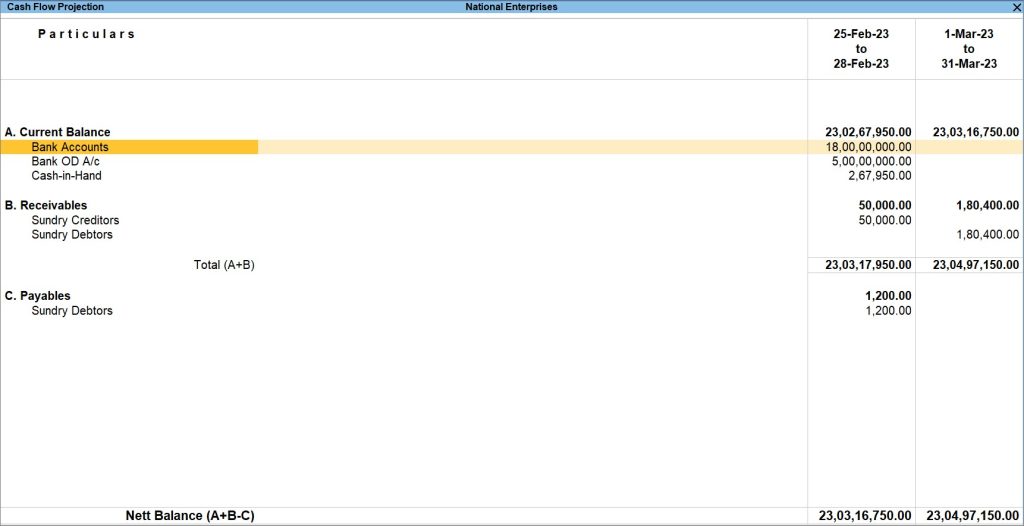
After the option Include Cash Account is changed to Yes, you can see the row Cash-in-Hand option appearing below Current Balance section along with Bank Accounts and Bank OD A/c, which now sum up to become the Current Balance.
Memorandum, Reversing Journal, and Optional Vouchers
![]()
By default, the Cash Flow Projection excludes Memorandum Vouchers, Reversing Journals, and Optional Vouchers. However, you can configure the Cash Flow Projection to include these vouchers. If you want to include Memorandum Vouchers, Reversing Journals or Optional Vouchers, then you need to create Scenarios first. Once the Scenarios are created, you can see the option Include Scenarios in Basis of Values.
- Open Cash Flow Projection > press Ctrl+B (Basis of Values).
- Change Include Scenarios to Yes.
Now, if you have recorded any entry using Memorandum vouchers, Reversing Journal, and Optional vouchers, you can see those data reflected in the Cash Flow Projection report. You can also know more about Memorandum, Reversing Journal, and Optional vouchers.
Overdues
![]()
By default, the Cash Flow Projection excludes uncleared and overdue bills. However, you can configure the Cash Flow Projection to include such bills.
- Open Cash Flow Projection > press Ctrl+B (Basis of Values).
- Change Include Overdues to Yes.
After the option Include Overdues option is changed to Yes, you can see the Overdue Receivable row added to the Receivables section and Overdue Paybles row added to the Payables section.
This report briefly summarizes the various aspects of your current business scenario according to Cash Flow and Cash Flow Projection report and gives you an idea to plan for the future of your business accordingly.