Statistics Report
Statistics is crucial in business as you can make decisions based on the historical data and ongoing trends. Accurate statistical data always serves as the basis for critical decisions and with TallyPrime you can view the Statistics of your business as per your requirements. The Statistics report in TallyPrime provides you with a snapshot of all the masters created and the number of voucher types entered. With the Statistics report, viewing and comparing statistical data has become simpler.
View Statistics Report: You can see all the transactions and masters from the last date of voucher entry in a single view. By default, the Types of Vouchers and Types of Accounts are displayed in the report side-by-side. However, varied configurations in TallyPrime will allow you to view the report as per your business requirements. For instance, if you want to see the details in a single vertical column, you can enable the option for Vertical Statistics in the F12 configuration.
Compare Statistical Data: If you are maintaining data for more than one business in your TallyPrime, you can use the Statistics report to compare business data within a single company or across multiple companies. For instance, you can view the monthly comparison of the number of sales vouchers and other vouchers recorded by your company in the report. Or you may have upgraded to a newer version of TallyPrime and the data is being recreated in this process. While migrating from one release of TallyPrime to the other, you can retain the information of the Statistics report in the previous release and compare it with the latest release.
You can use the Statistics Report to drill down to specific transactions to get more details. To know more about using the common features in Statistics report, refer to How to Use Reports in TallyPrime
View Statistics Report
The Statistics Report provides you with detailed information about the types of vouchers and accounts involved in your business transactions for a particular period. By default, you can view the statistics side by side in a columnar format.
In this section
View Default Report
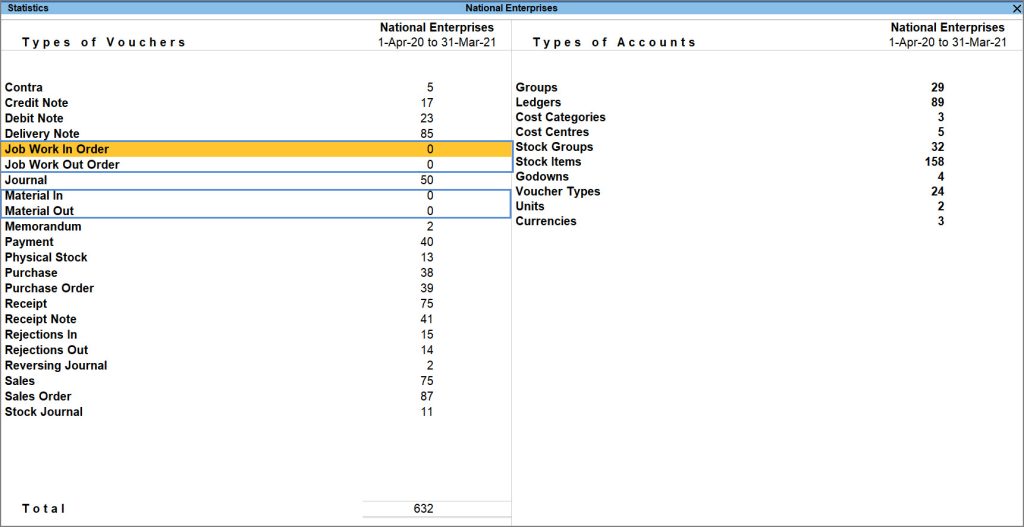
The Statistics report displays the types of vouchers and types of accounts side-by-side by default. You can see the total number of vouchers passed and accounts involved in your business transactions in a particular period. Suppose you want to view the Journal entries passed during March, you can:
![]()
- Press Alt+G (Go To) > type or select Statistics > and press Enter.
Alternatively, Gateway of Tally > Display More Reports > Statement of Accounts > Statistics.
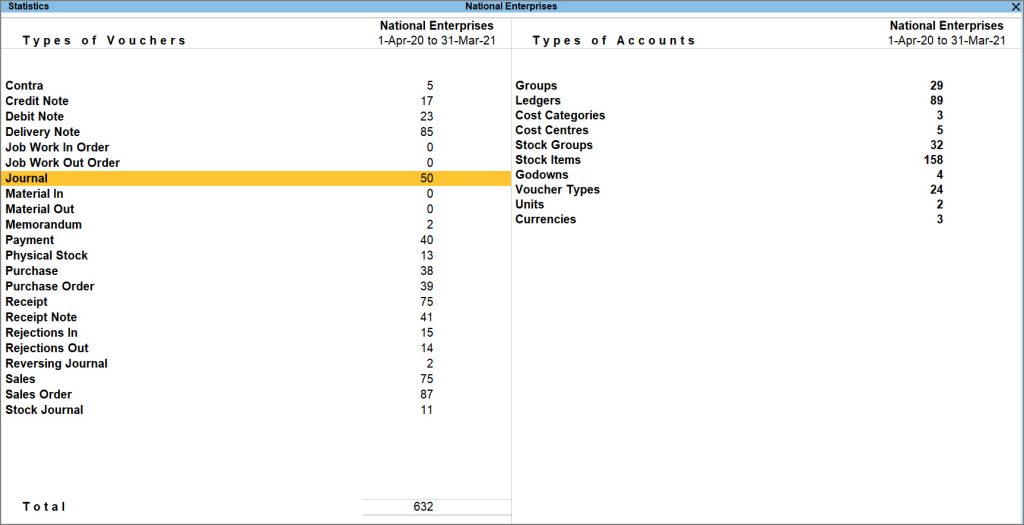
- Drill down a specific type of voucher to view the details. For example, you can select Journal as Type of Vouchers and press Enter. The Voucher Monthly Register screen appears as shown below:
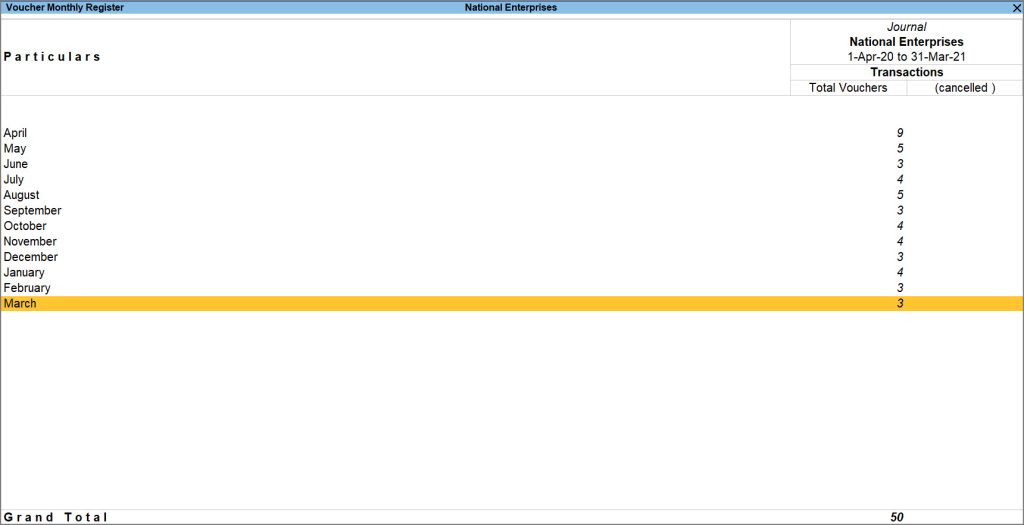
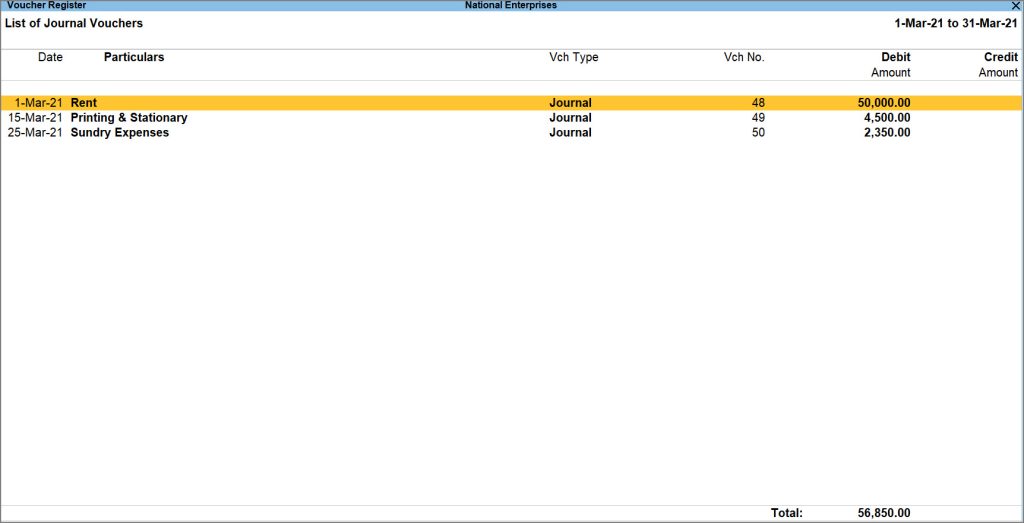
- Drill down from the required month for more details, such as Voucher Numbers, Invoice Amounts, and the Total Amount.
Vertical Statistics
By default, Statistics displays the Types of Vouchers and Types of Accounts side by side. However, if you want to see the details in a single vertical column, then you can configure Statistics accordingly.
- Press Alt+G (Go To) > type or select Statistics > and press Enter.
Alternatively, Gateway of Tally > Display More Reports > Statement of Accounts > Statistics. - Press F12 (Configure).
- Set Show Vertical Statistics to Yes.
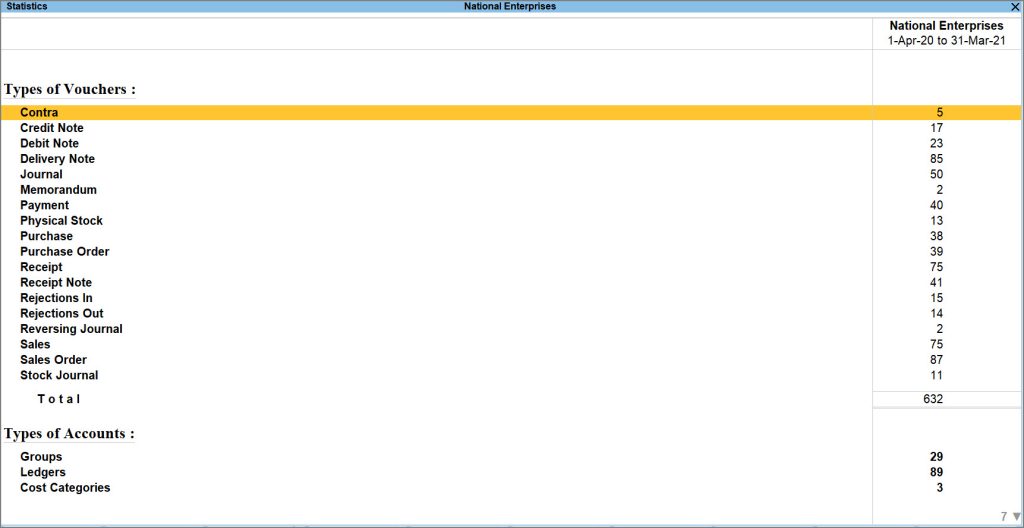
The Statistics report displays the Types of Vouchers on the top, and the Types of Accounts on the bottom instead of displaying them side-by-side.
Alternatively, press Ctrl+H (Change view) to modify the view of the Statistics report.
Sort by Default Vouchers
There are 22 default voucher types available in TallyPrime that are sorted alphabetically by default in the Statistics report. Suppose you create additional vouchers apart from the pre-defined ones,
- The default report sorts all the voucher types – both predefined and the ones you have created – alphabetically.
- On setting Sort by Default Vouchers to Yes, TallyPrime sorts the pre-defined voucher types alphabetically and groups the additionally created voucher types under their respective groups.
This helps you to get a consolidated view of the voucher types, depending on your business requirements.
Vouchers with Zero Entries
It could be possible that there were certain vouchers that did not have any entries made in a particular period. By default, the Statistics report includes voucher types that have zero entries.
However, you can configure the Statistics report in TallyPrime to exclude such entries to see only the relevant voucher types.
- Press Alt+G (Go To) > type or select Statistics > and press Enter.
Alternatively, Gateway of Tally > Display More Reports > Statement of Accounts > Statistics. - Press F12 (Configure).
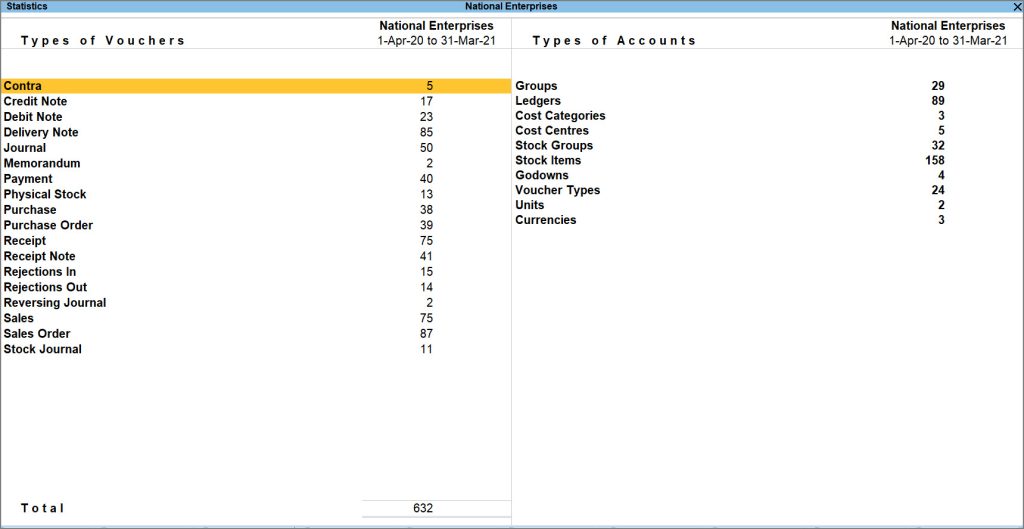
- Set Show Voucher Types having entries only to Yes.
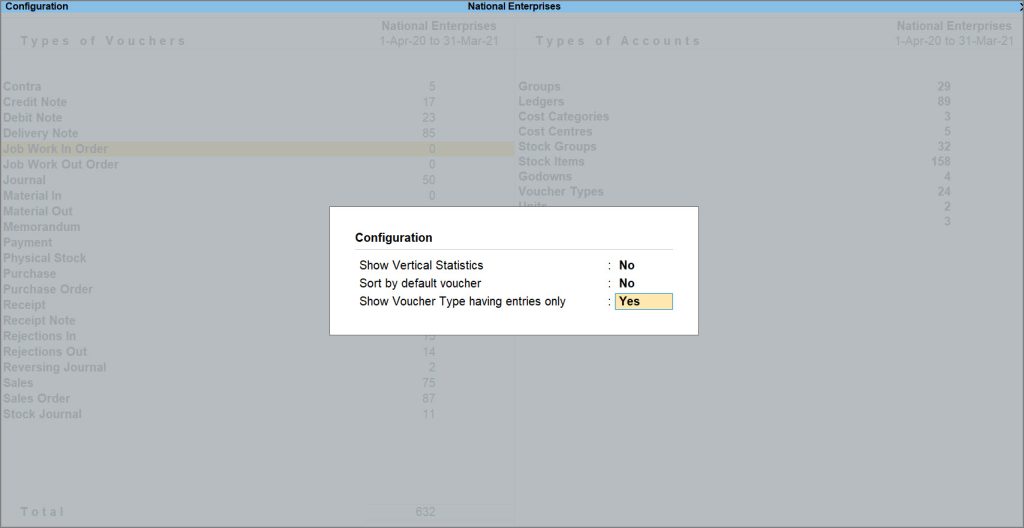
You can see that Statistics now displays only the voucher types that have at least one entry.
Compare Statistical Data
Comparing your business data helps you know more about your business performance. TallyPrime allows you the flexibility of selecting varied columnar views as per your requirement and viewing them in the Statistics report.
In this section
- Compare data within a company
- Compare data between different companies
- Compare data between different versions of TallyPrime
Compare Data within your Company
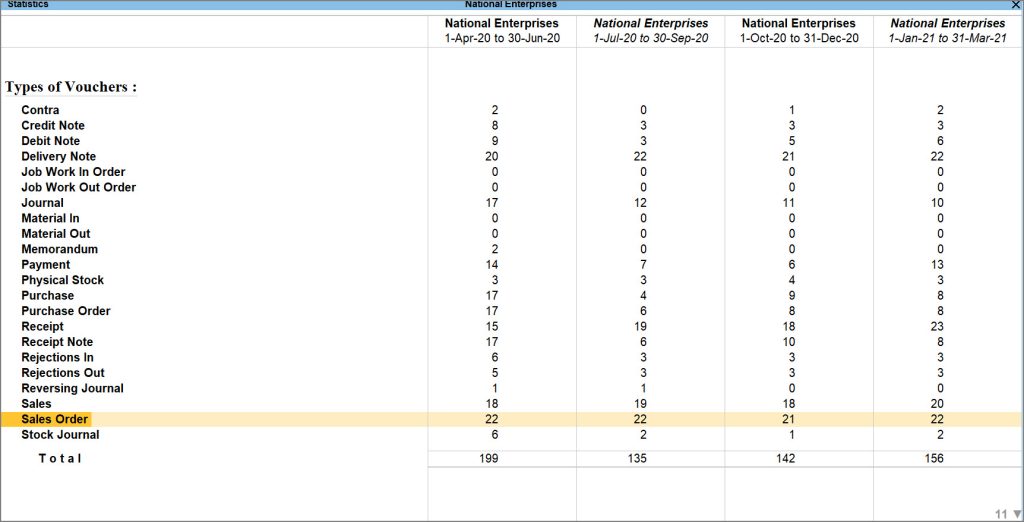
Let us assume that you want to know in which quarter the company recorded more orders from the customers. With TallyPrime you can view the Sales Order that in your Statistics report and gain a clearer perspective of the sales vouchers recorded in your company. To compare the data:
![]()
- Press Alt+G (Go To) > type or select Statistics > and press Enter.
Alternatively, Gateway of Tally > Display More Reports > Statement of Accounts > Statistics. - Press Alt+N (Auto Column).
- In the Auto Repeat Columns screen, select Quarterly from the list of Auto Column.
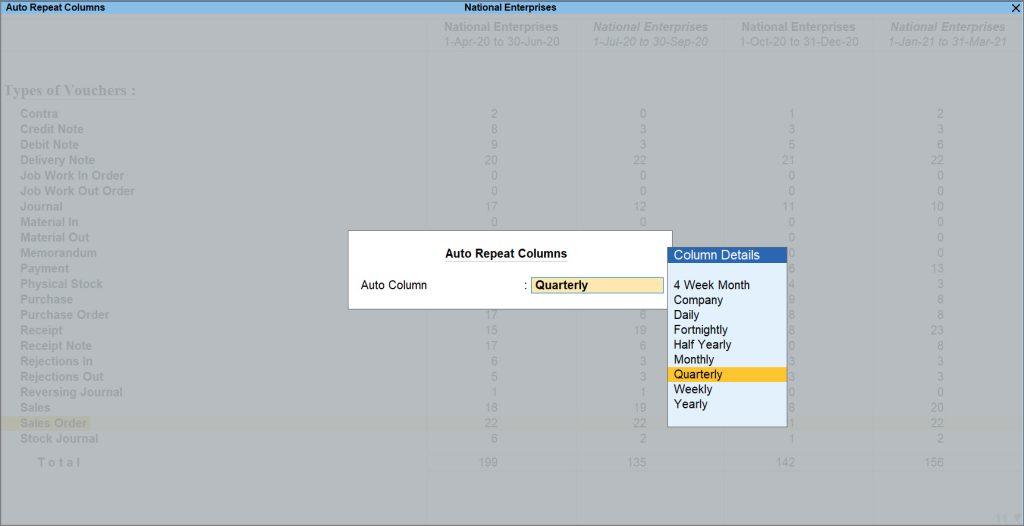
You can view the trend of Sales Order in a particular business quarter and compare it.
- Select the Voucher Type and further drill down to get more details by pressing Enter.
This will help you in making business decisions like analysing the reason for the company’s downfall in a particular quarter and take corrective measures to fix it.
Compare Data with another Company
Similarly, you can also compare your company’s statistical data with another company. Let us assume that you have a sister concern for your company and want to compare the number of sales vouchers recorded in both the companies. One company might record a greater number of sales vouchers than the other. This comparison will help you in analysing why the business performance is low for the other company. TallyPrime allows you to view both the company’s data side by side in the Statistics report. To compare the companies’ performance:
![]()
-
- Press Alt+G (Go To) > type or select Statistics > and press Enter.
Alternatively, Gateway of Tally > Display More Reports > Statement of Accounts > Statistics. - Press Alt+N (Auto Column).
- In the Auto Repeat Columns screen, select Company from the list of Auto Column.
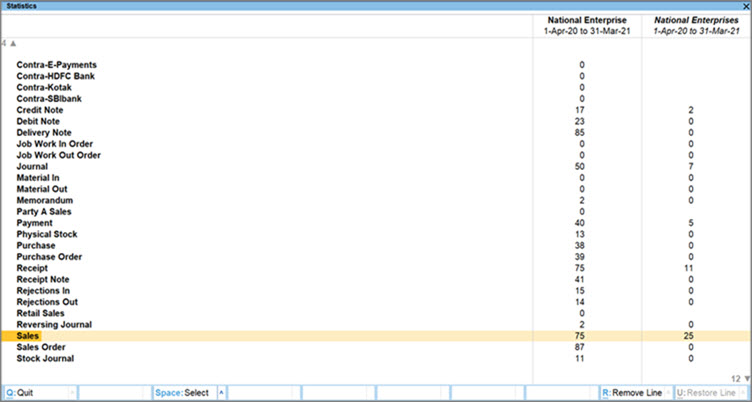
The varied Types of Vouchers of both the companies are listed in the Statistics report. - You can further drill down for more details by pressing Enter.
This will further help you in taking corrective actions to improve the Sales for the company with a lower performance.
- Press Alt+G (Go To) > type or select Statistics > and press Enter.
Compare Post-migration Data in TallyPrime
Statistics report also helps in keeping a historical track of your business data and use it for future reference. Let us suppose that you have upgraded to a newer version of TallyPrime and the data is being recreated in this process. While migrating from one release of TallyPrime to the other, you can retain the information of the Statistics report in the previous release and compare it with the latest release. Statistics report will be helpful in comparing the pre-migration and post-migration data in TallyPrime.