Use Stock Item Movement Analysis Report in TallyPrime
Item Movement Analysis in TallyPrime helps you understand the inward and outward movement of stock items. This helps you in determining the stock flow and make decisions about sales and purchase. In TallyPrime, you can:
- View Stock Item Movement Analysis: Analyse stock movement, production, consumption, purchases, sales, and effective rates across periods.
- View Stock Group Movement Analysis: Analyse movement of items within a stock group.
- View Stock Category Movement Analysis: Analyse movement of items within a stock category.
- View Stock Movement Analysis through Groups: Analyse stock items in transactions with ledgers under a group and identify parties purchasing or selling them.
- View Stock Movement Analysis through Ledger: View stock items in sales and purchase transactions.
- View Stock Transfer Analysis: Analyse and verify production, consumption, and inter-Godown transfers recorded through Stock Journals.

Ensure that:
- You have created stock items.
- You have created stock groups and stock categories.
- You have created godowns, as applicable.
View Stock Item Movement Analysis
- Press Alt+G (Go To) > type or select Stock Item Movement Analysis and press Enter.
- Name of Item: Select the stock item from the List of Stock Items.
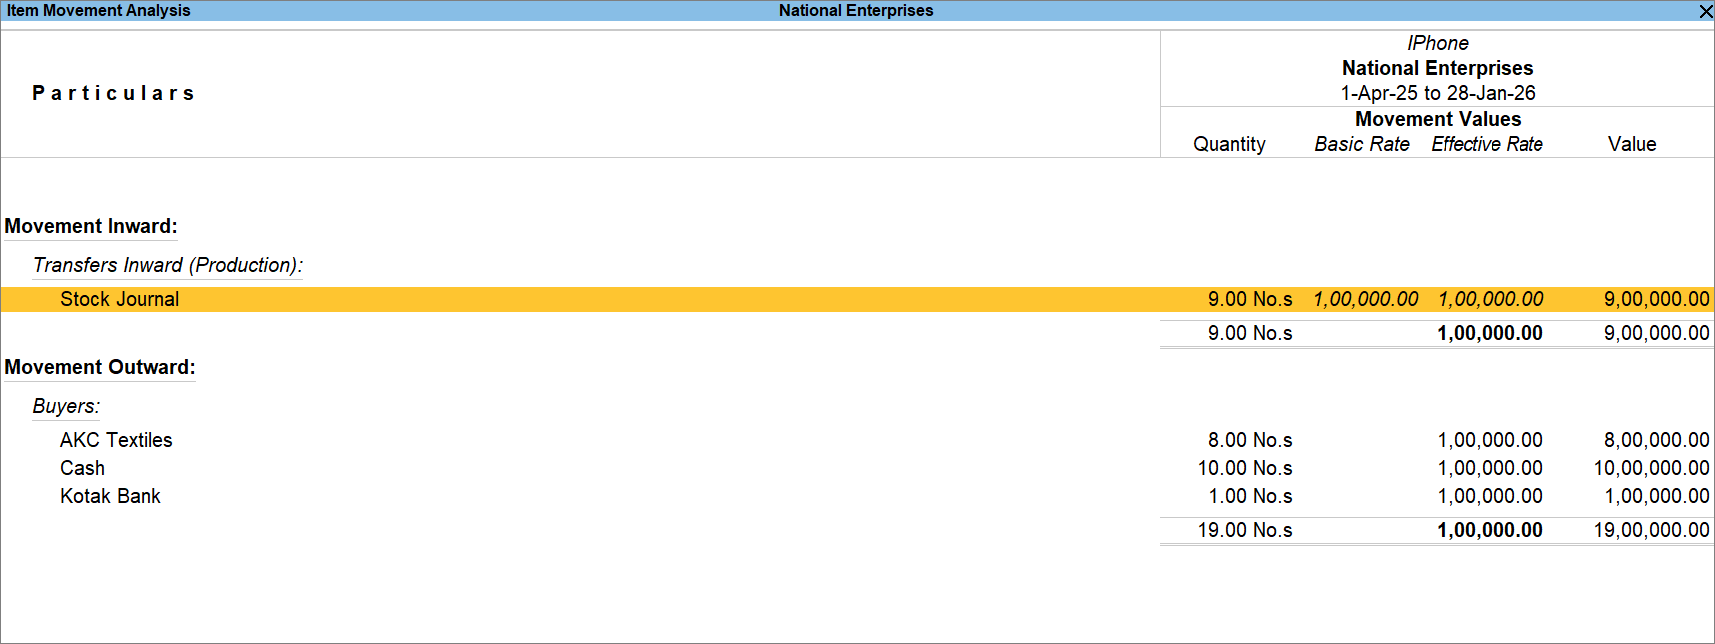
You can view the total value of stock items purchased (inwards) and sold (outwards). The Effective Rate includes additional cost (such as transport charges) on the transaction containing stock items. - To view transaction level details of the item, select a ledger and press Enter.
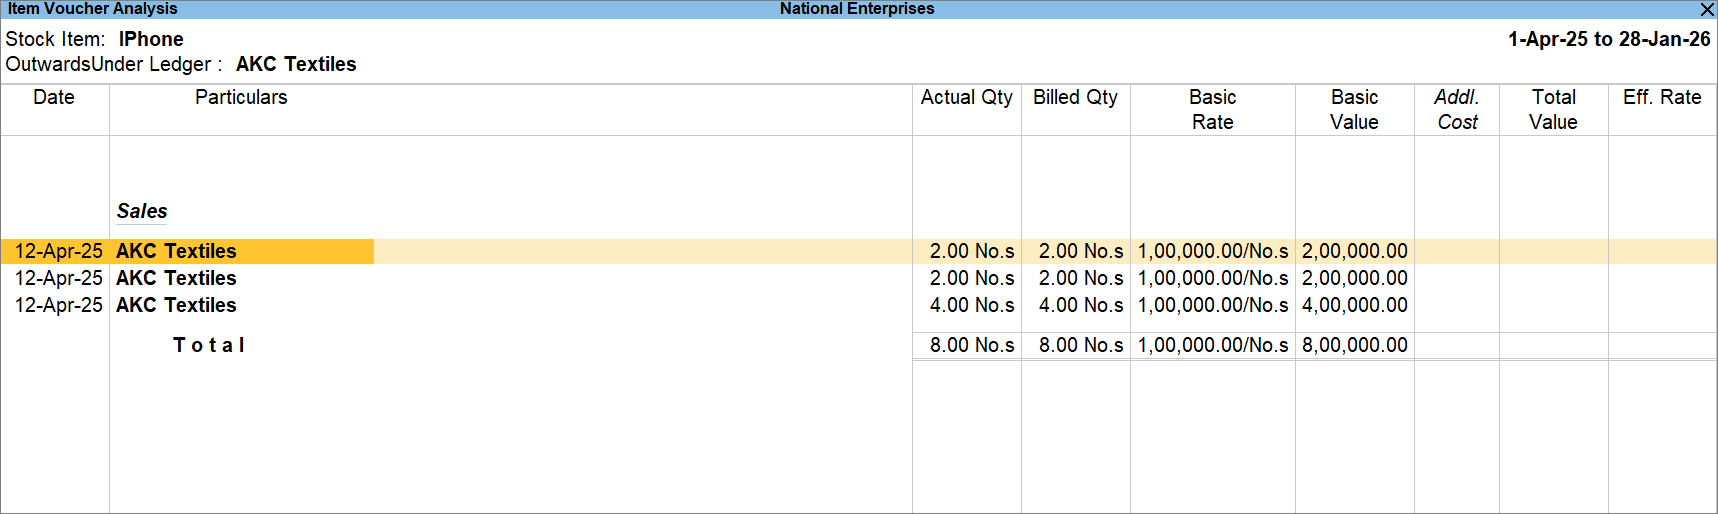
By default, the report displays Quantity. However, if you have maintained actual and bill quantities, then the Item Voucher Analysis displays the Actual and Billed Qty along with Basic and Effective Rate. - To view Additional Cost Details, press F12 (Configure) and set Show Additional Cost Details as Yes.
If there are any additional charges on transactions containing the stock item, then the Item Voucher Analysis report gives you the details of additional cost.
To view the report for a different stock item, press F4 (Stock Item).
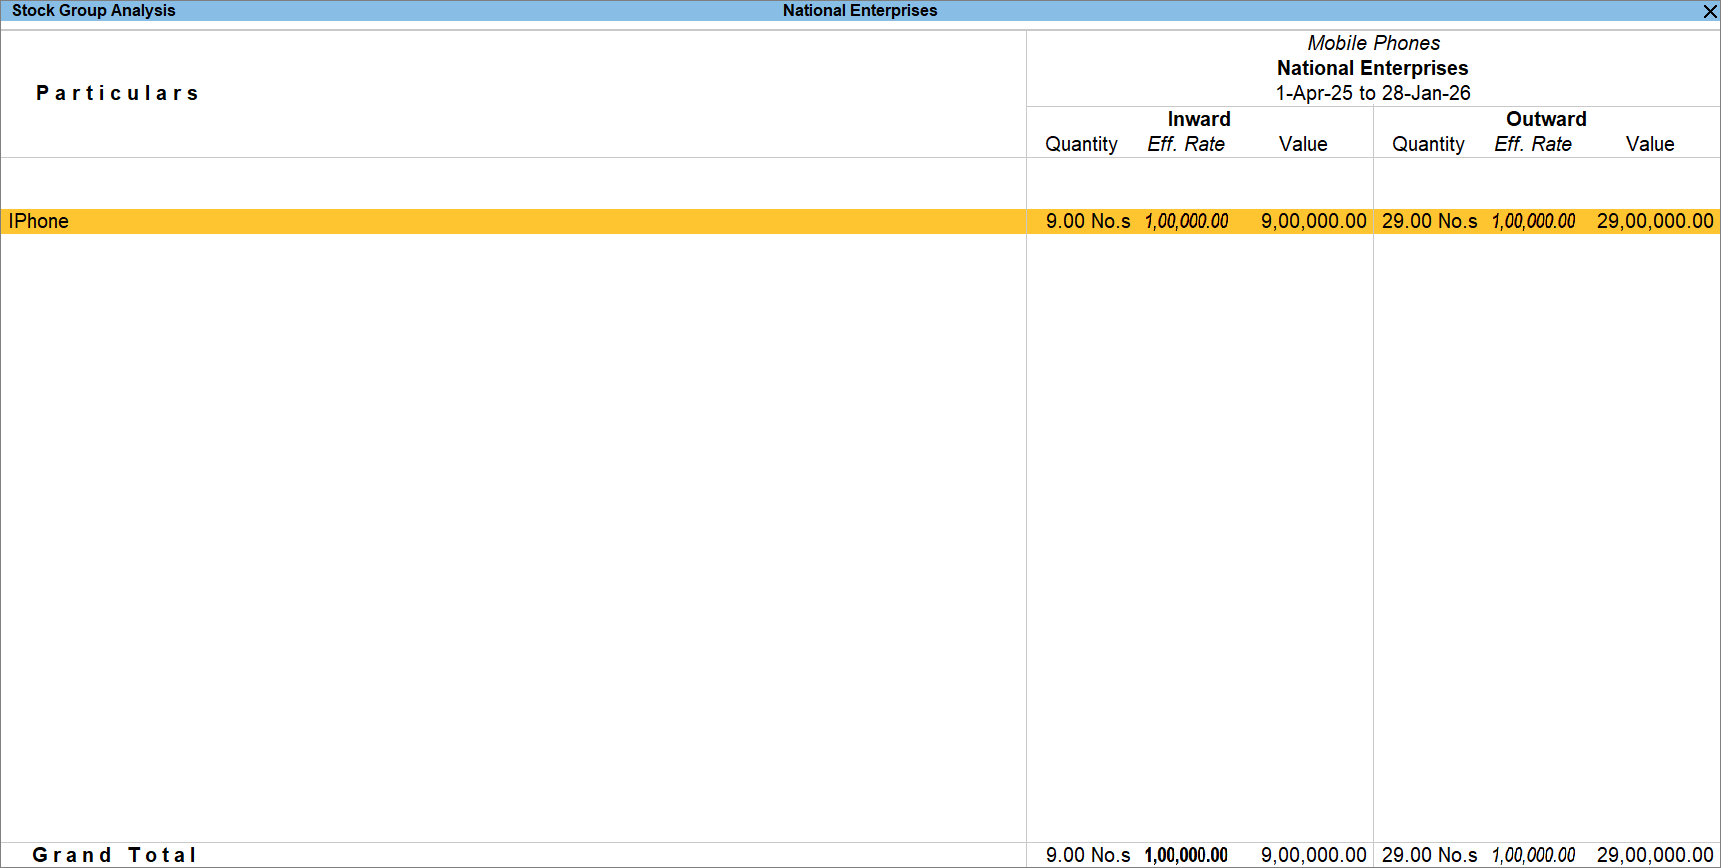
View Stock Group Movement Analysis
- Press Alt+G (Go To) > type or select Stock Group Movement Analysis and press Enter.
- Name of Group: Select the stock item from the List of Stock Group.
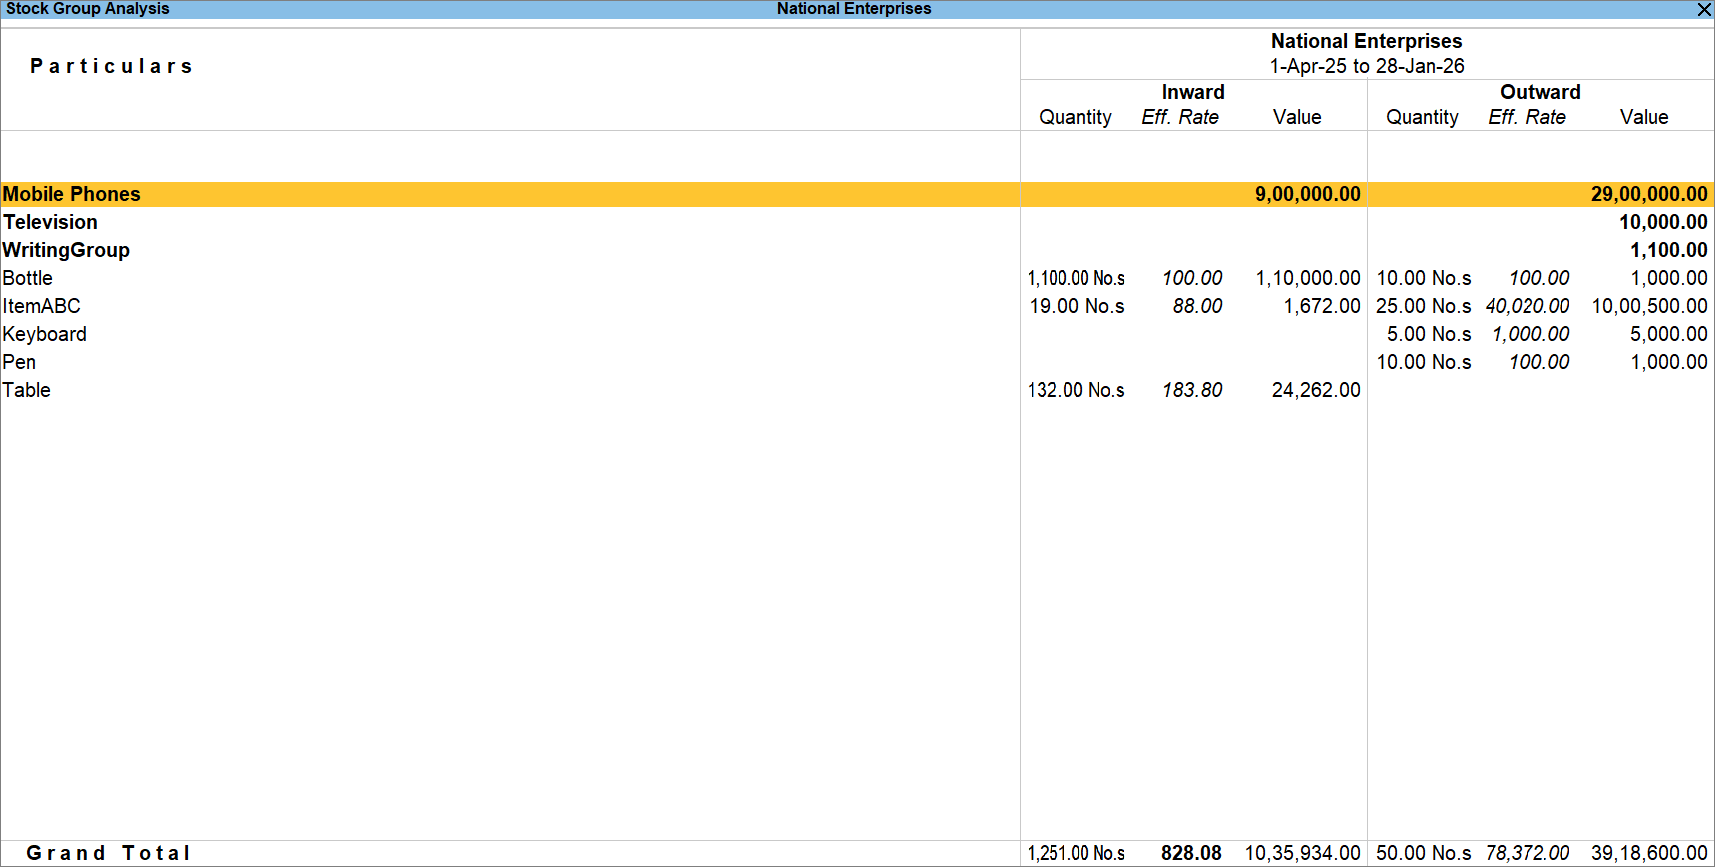
- To view the stock items purchased and sold, select a stock item, and press Enter.
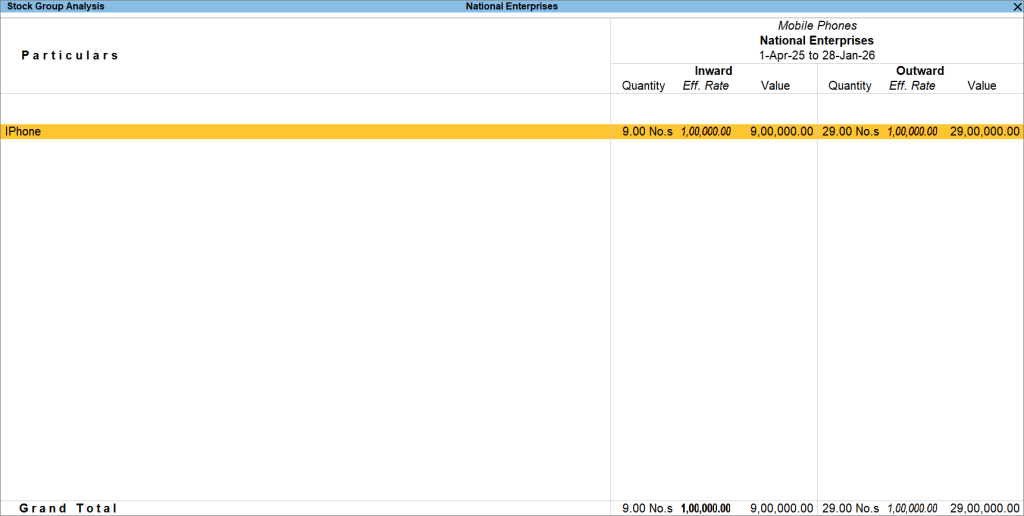
The report gets displayed for a specific group, displaying items under that group along with the Inward and Outward inventory movement. - To view the report for a different stock group, press F4 (Stock Group).
- To view the report Stock Item-wise, press F5 (Stock Item-wise).
- To view Ageing Analysis for a stock item, press Ctrl+H (Change View) > Ageing Analysis.
To know more, refer to Stock Ageing Analysis in TallyPrime.
View Stock Category Movement Analysis
If you have created stock categories and want to know the movement of stock items within categories, then you can view the Stock Category Movement Analysis.
- Press Alt+G (Go To) > type or select Stock Category Movement Analysis and press Enter.
- Name of Category: Select the Category from the List of Stock Categories.
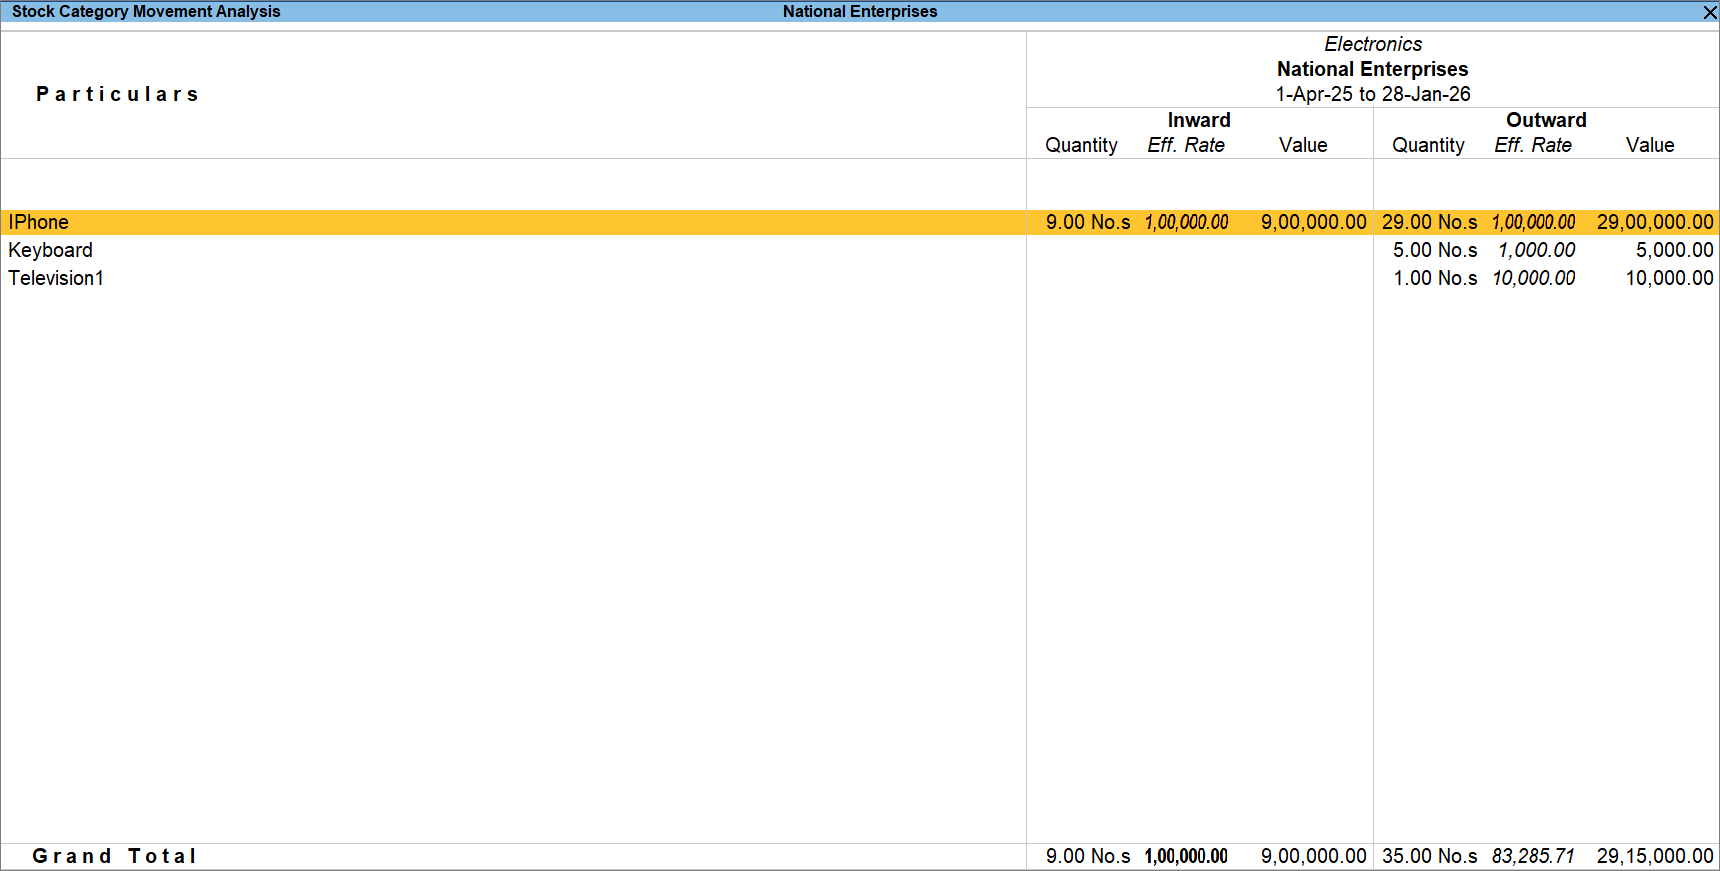
The report gets displayed for a specific category, displaying items under that group along with the Inward and Outward inventory movement. - To view the report for a different stock category, press F4 (Stock Category).
View Movement Analysis of Stocks through Groups
- Press Alt+G (Go To) > type or select Group Analysis.
- Name of Group: Select the group from the List of Groups.
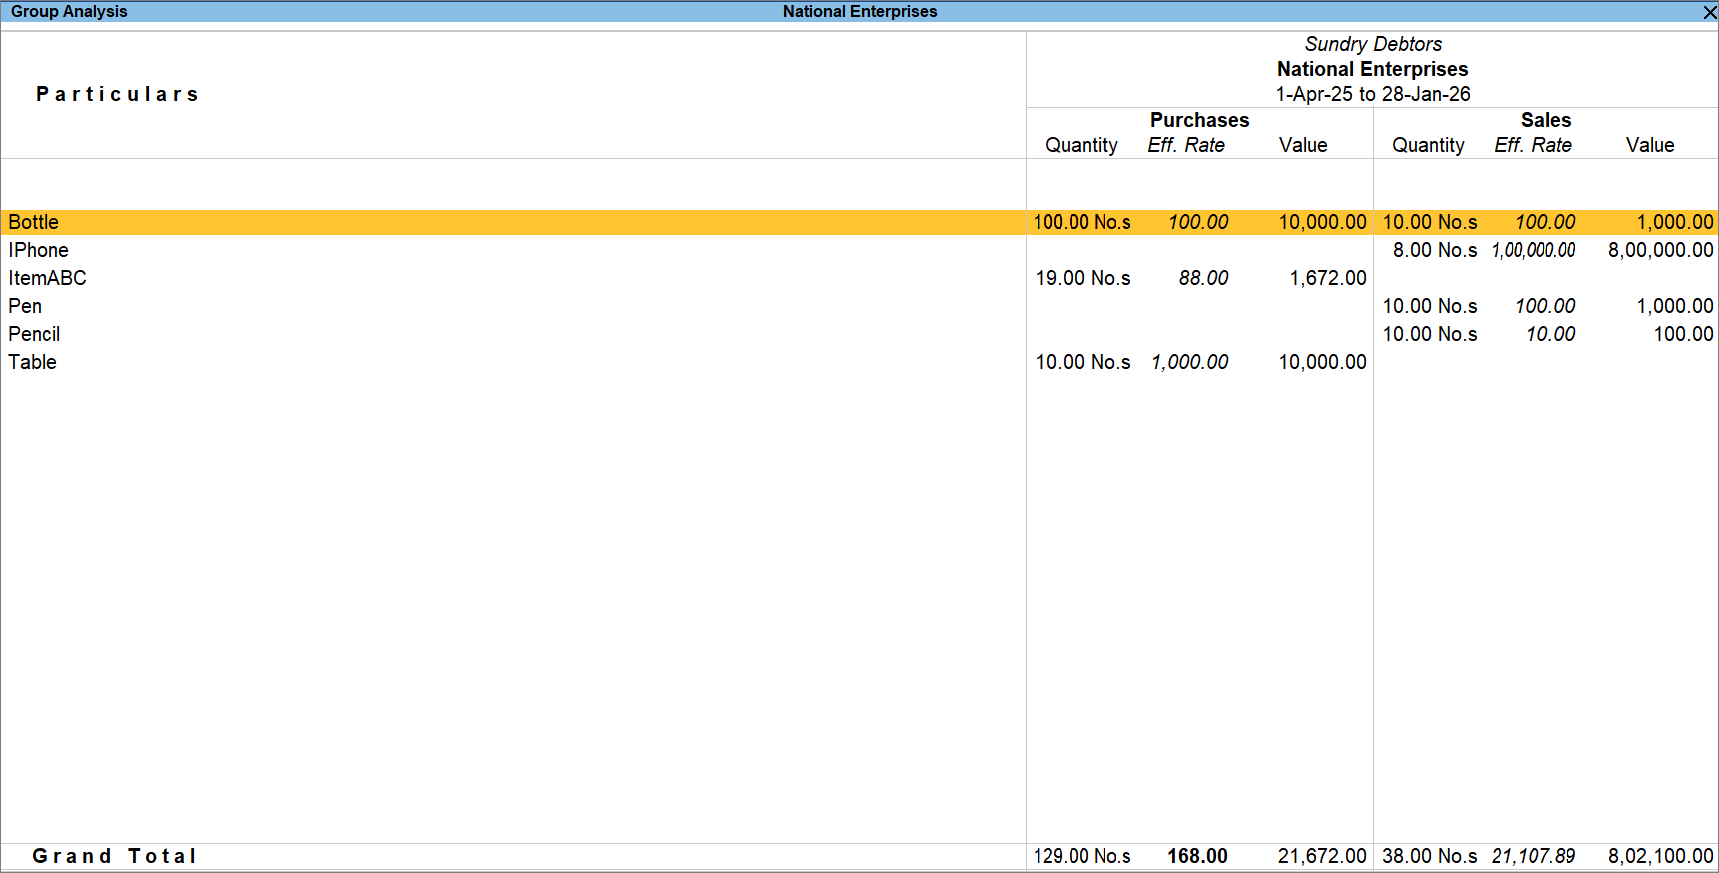
With this report, you can compare the quantities purchased and sold, along with the rates.
View Movement Analysis of Stocks through Ledgers
- Press Alt+G (Go To) > type or select Ledger Analysis and press Enter.
- Name of Ledger: Select the ledger from the List of Ledgers.
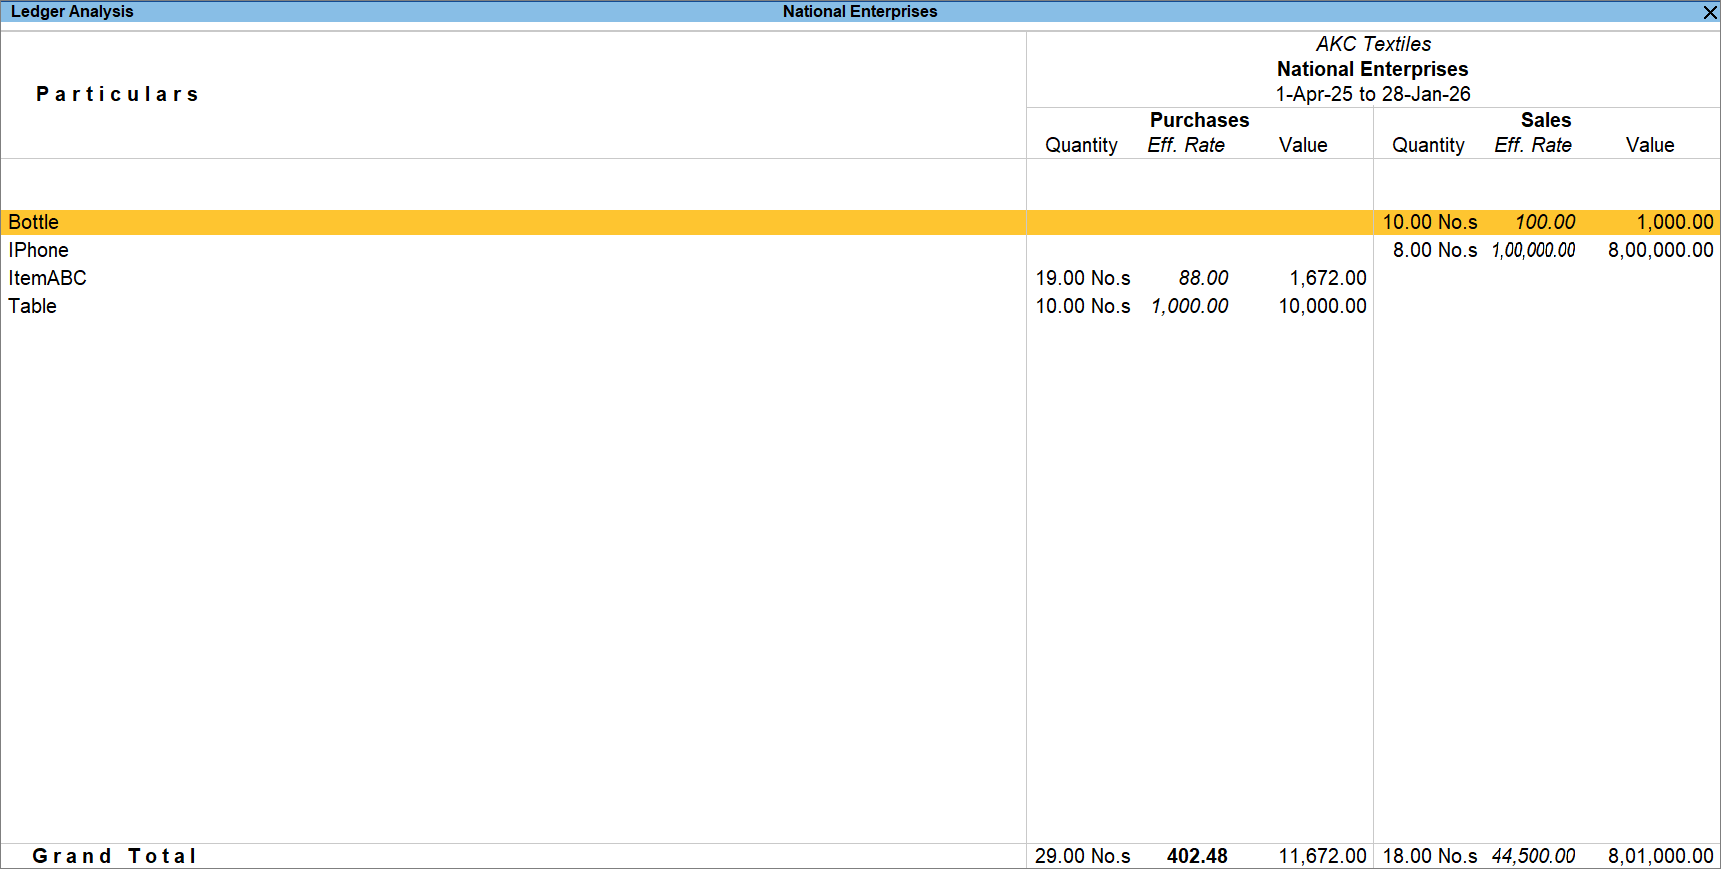
With this report, you can compare the quantities purchased from and sold to a specific party, along with the rates.
View Stock Transfer Analysis
- Press Alt+G (Go To) > type or select Stock Transfer Analysis and press Enter.
- Name of Voucher: Select the voucher type from the List of Voucher Types.
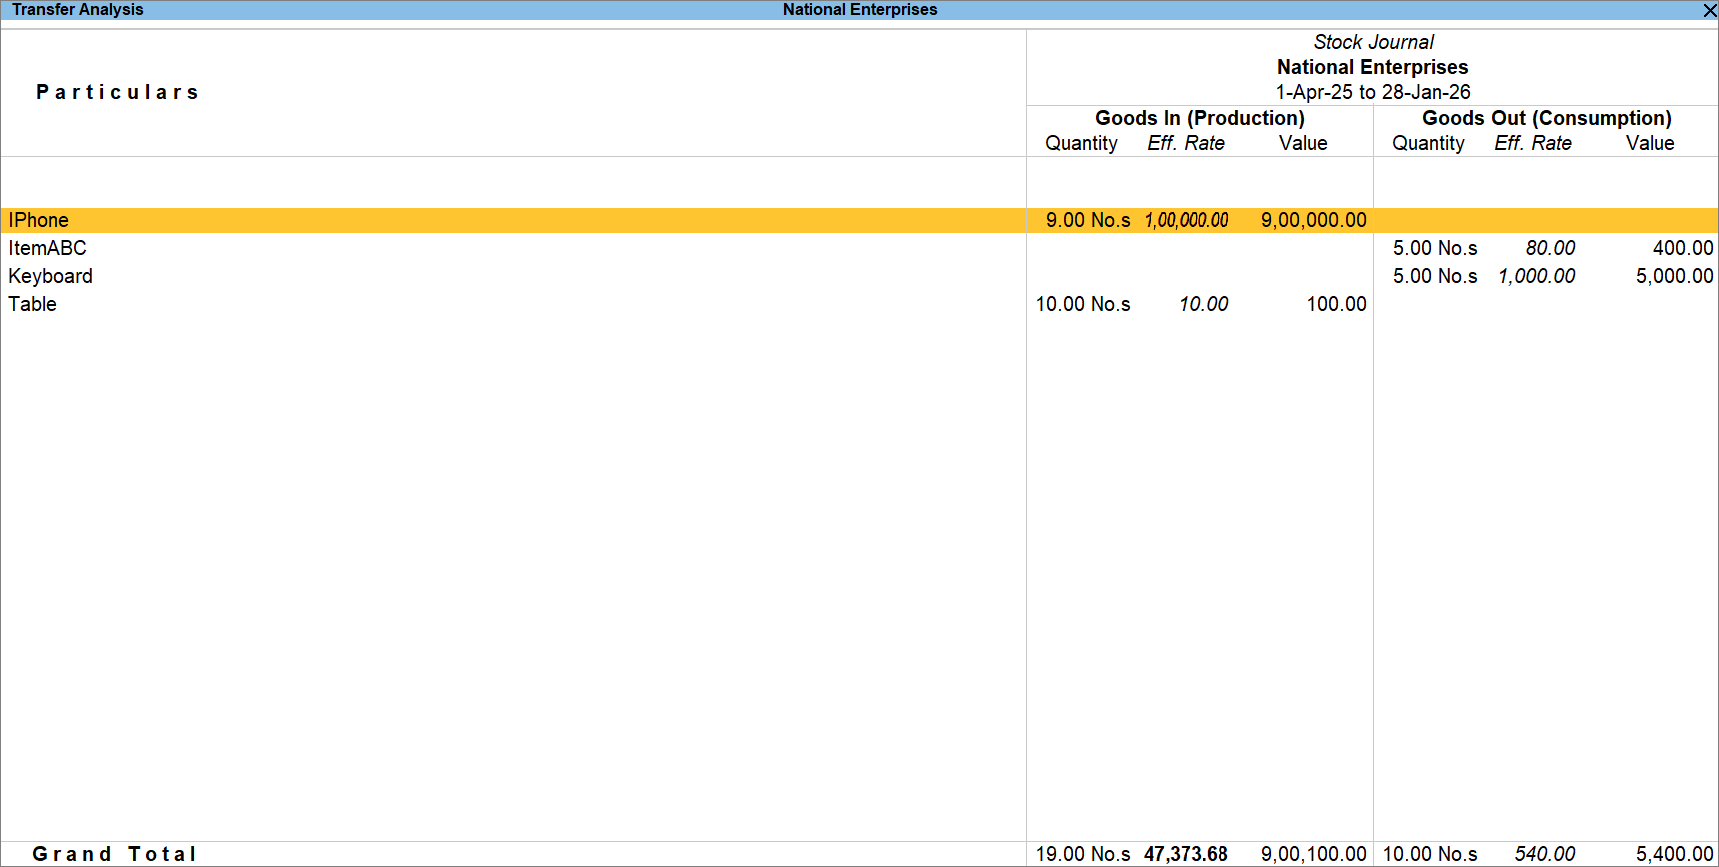
With this report, you can determine the stock movement during production and consumption and identify the difference in rates during both the stages. - To view the report for a different Voucher Type, press F4 (Voucher Type).
Questions & Answers
- Rate of a stock item appears lower than the actual cost of purchase I paid to the supplier. Why is their a discrepancy between the rate of stock item and the amount paid?
A lower item rate does not always mean a lower purchase cost. Additional expenses such as freight, handling, or other procurement costs can increase the effective cost of an item.
To identify suppliers with higher purchase costs, in the Item Voucher Analysis report, press F12 (Configure) and set Show Additional Cost Details as Yes.
- How can I identify the customers or suppliers who contribute the most to the movement of a specific stock item?
From Group Analysis or Ledger Analysis, drill down to the item level and evaluate its movement by customer or supplier.
Review the quantity and value of transactions associated with each party to identify the largest contributors.
Is this information useful?
YesNo