Track Your Inventory | Stock Summary
Stock Summary is a statement of the real-time stock-in-hand on a particular day. It allows you to view profits made from stock sales according to each single stock item or for each group. It is one of the primary inventory statements that gets updated in real-time as and when you record transactions. If you have maintained the inventory in groups, transferred stock for various business needs, sold or purchased stock items, TallyPrime helps you view all of them using the Stock Summary report. Monitoring your profit margins regularly when you do business with your vendors and maintaining your future transactions becomes much easier when you have the value of your profit for each stock item against the sale and purchase price.
Know your stock details: Stock Summary provides information on stock items such as quantity, rate, and opening and closing value of the stock items. You can view the entire stock flow, including goods inward, goods outward, opening stock, and closing stock. Whether it is about stock reordering or stock ageing, you can get the right information about the inventory in your business using this report. You can understand the movement of a particular item day-on-day, month-wise or for any selected period.
Understand sales and purchases of stock: You can view details of the available stock at different locations and make a purchase or sales decision accordingly. A clear view of the purchase and sales order outstanding helps you further decide on the next steps to improve the cash flow in your business.
Know stock-wise profit: When you make business transactions with your vendors, you will need to keep a tab on your profit margins regularly. Understanding the profit value against the sales and purchase value of the items help in maintaining your future transactions. Using the Stock Summary report, you can view the profit made from sales of stock items, individually or per group.
Summarising what you have in stock in terms of quantity and value, this report helps you make vital inventory-related decisions very quickly. With a detailed overview of the stock flow, including the number of goods entering, the number of goods left, and the number of goods closing, this Stock Summary report provides you with accurate information about your inventory regarding stock replenishment or inventory ageing. Similar to all other reports in TallyPrime, you can drill-down from the Stock Summary report to view various inventory information as per your business needs.
You can view this report in the browser.
View Stock Item Details in Inventory Reports | Stock Summary and Monthly Summary
Whether you maintain your stock individually or in groups, you will be able to know the opening and closing balance of your stock on any given day. In the Stock Summary report, you can view the stock balance and profits made from sales of your stock.
In this section
- View Stock Item details through Stock Summary
- View Stock Item details through Monthly Summary
View Stock Item details through Stock Summary
![]()
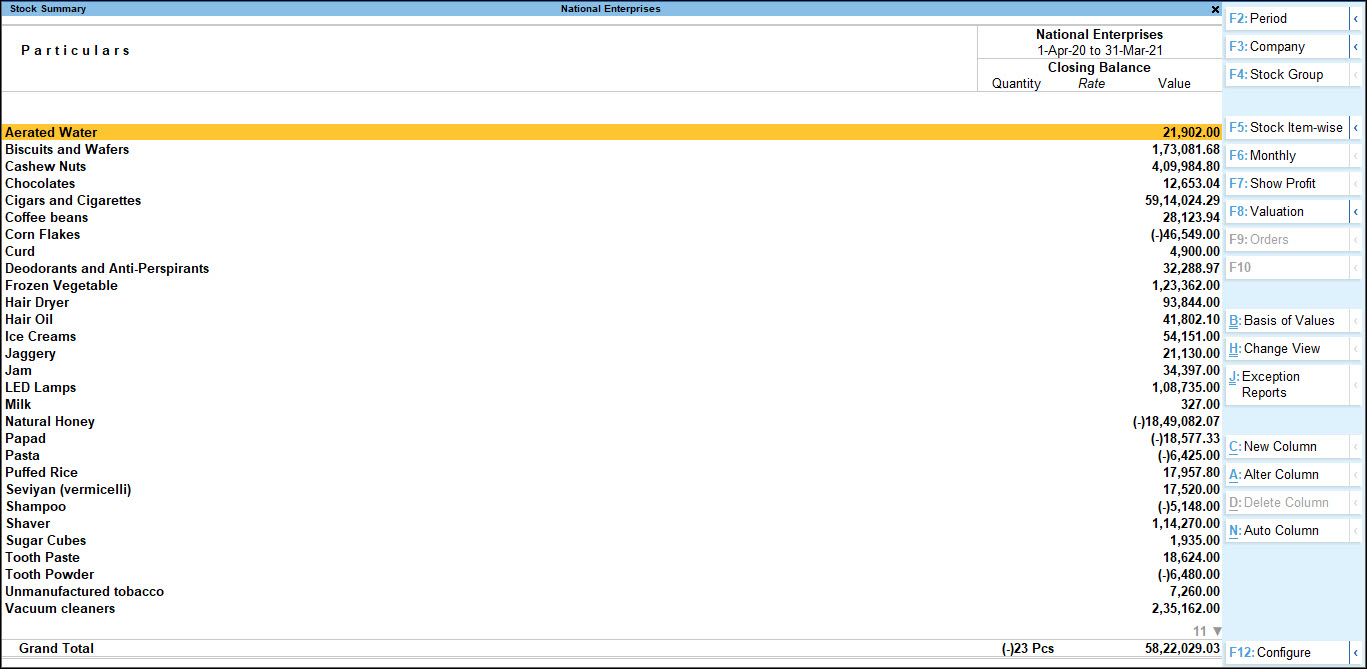
Stock Summary report helps you to know how much stock quantity you currently own, your pending sales as well as purchase orders and how they will affect your stocks in-hand, and your existing stock for supplying your customers. The value of the closing stock shown in Stock Summary is also displayed in the Profit and Loss report. If you do not see the same value in the Profit and Loss report, ensure that you have set the Integrate Accounts with Inventory to Yes from the F11 (Features).
- Press Alt+G (Go To) > type or select Stock Summary and press Enter.
Alternatively, Gateway of Tally > Stock Summary.
By default, the Stock Summary report displays the item-wise summary of your inventory along with the list of stock items with their corresponding closing balance details.
- After you generate the Stock Summary report, you can drill down to access the details of your stock group and stock item from Stock Group Summary and Stock Item Monthly Summary, respectively. You can further drill down to access the last level of data in the Stock Item Vouchers.
From the Stock Summary Report you can choose to view items from other group, stock item-wise and profit earned from the stock.
- F4 (Stock Group): When you have stock items in groups, your can view details of any selected stock group by pressing F4 (Stock Group). After selecting a stock group, you can view the closing balance of the items under that stock group.
- F5 (Stock Item-wise): When you maintain stock items in different groups, you can toggle between the item-wise and group-wise view of the summary report by pressing F5 (Stock Item-wise). This option gives you the freedom to view your report according to your choice and convenience. You can also do the same by pressing Ctrl+H (Change View).
- F7 (Show Profit): Whether you have grouped your stock items or maintained them individually, it becomes tedious to track the profit manually. You can press F7 (Show Profit) to see the profit earned from your outward stock, including the consumptions made. This statement is used to reconcile the closing balance because the closing value is derived by taking the consumption values instead of the outward goods at sales value. You can use F7 (Hide Profit) to hide the profit-related details.

You can view the Stock Summary Report and make changes in the display of the report as per your business need.
- Ctrl+B (Basis of Values): You can choose to change the Scale Factor from Default to Hundreds or Thousands. The Stock Valuation Method can also be changed as per your business need. You can also select the Godown type and Stock Position to view the report.
- Ctrl+H (Change View): You can view Related Reports like Monthly Summary, Movement Analysis and Ageing Analysis, apart from the default report.
- Ctrl+J (Exception Reports): You can view the Negative Stock Items.
To know further about reports and their features in TallyPrime, go to Working with Reports in TallyPrime.
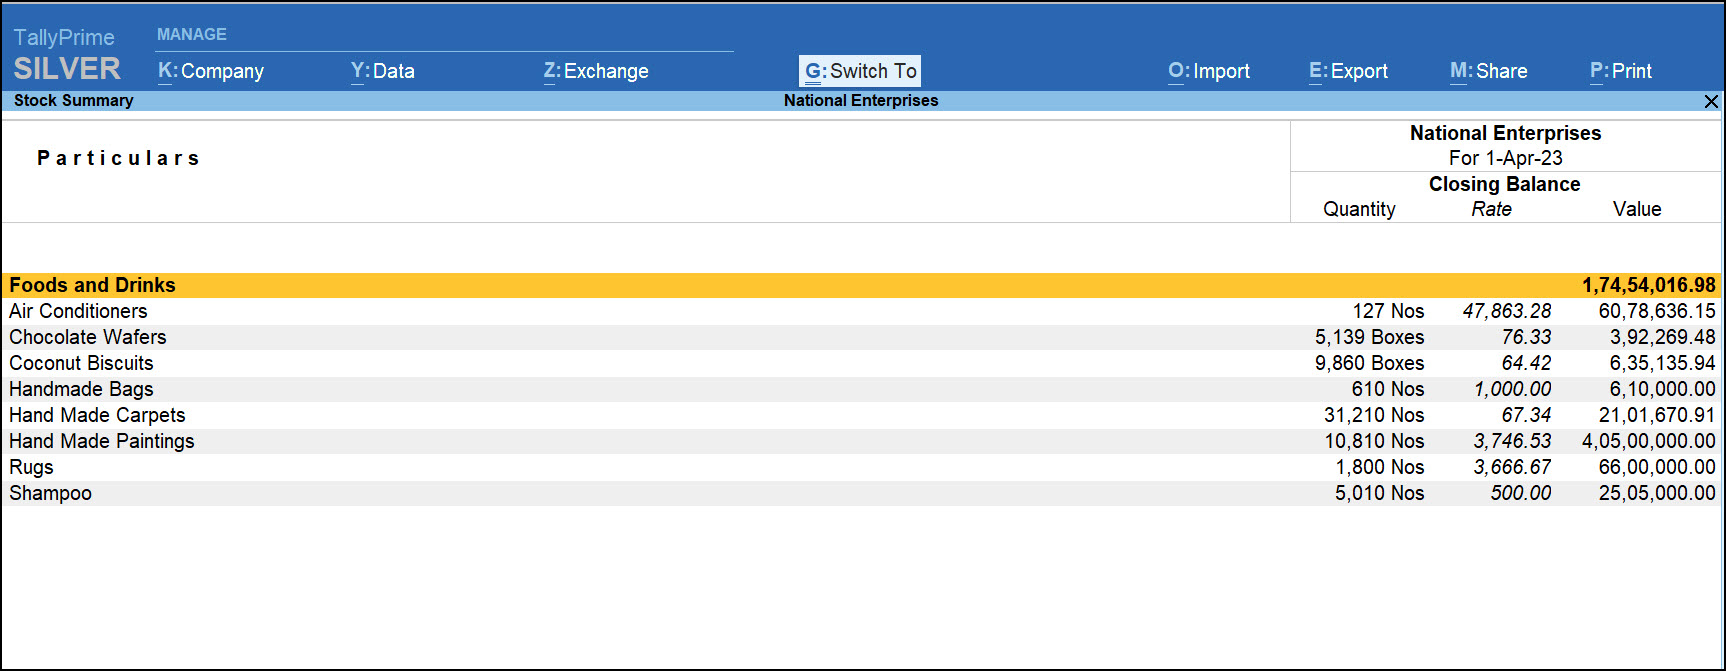
Stripe View: You can enable Stripe View for Stock Summary through F12 configuration. After doing so, you can view the report with stripes, ensuring a neat representation of data with maximum readability. In case, you wish to enable Stripes for all the reports, including Stock Summary, you can enable it at the application level.
To enable Stripe View only for Stock Summary:
- Open Stock Summary > press F12 (Configure) > set Enable Stripe View to Yes.
Once you have enabled Stripe View for Stock Summary, you can view the report, as shown below:
Similarly, you can enable Stripe View and Print, Export, as well as Share the reports with stripes with your parties for better readability.
For more information, refer to the Enable Stripe View section in the Get Familiar with TallyPrime and TallyPrime Edit Log Features topic.
F12 (Configure)
Press F12 (Configure) to configure your report as per your business needs.
- Opening Balance: Displays the Opening Balance – quantities, rates, and values – of the stock items or stock groups.
- Show Goods Inwards: Displays the inward quantities, rate, and corresponding values.
- Show Goods Outwards: Displays the outward quantities, rates, and corresponding values.
- Show Gross Value for Outwards: The gross value is inclusive of the value of tax/any other allowed ledgers that were chosen during the sales of the item.
- Show Consumption and Gross Profits: The gross profit is calculated on the gross value, which is inclusive of the values of the tax/allowed ledger under the accounting allocation screen of the stock item.
- Show Gross Profit on Gross Value: The gross profit and percentage values are calculated on the gross value.
To know more about F12 (Configure), click here.
|
Option |
Description |
|
Show Quantity |
Displays the quantity of the stock items or stock groups. |
|
Show Alternate Units |
Displays the quantity of stock along with alternate units. |
|
Show Rate |
Displays the rate for each stock item or stock group. |
|
Show Value |
Displays the value of the stock per item or group. |
|
Show Closing Balance |
Displays the Closing Balance – quantities, rates, and values – of the stock items or stock groups. |
|
Show Stock Items with zero Quantity or Balance |
The Stock Summary report by default excludes stock items with zero closing balance in terms or quantity or amount. Therefore, you will find this configuration set to No. If you wish to see such stock groups listed in the report, you can set this option to Yes. |
|
Exclude details with no transactions |
The Stock Summary report by default excludes stock items not used in transactions. Therefore you will find this configuration set to Yes. If you wish to see such stock items or groups that contain such stock items along with other stock, you can set this option to No. |
|
Format of Report |
Displays the report in detailed or condensed format. |
|
Expand all levels in Detailed format |
Displays the last or tail unit used to create the compound unit for the stock items. |
|
Display name for Stock Items |
Displays the alias name, part no., stock name or different combinations of these. |
|
Display name for Stock Groups |
Displays the alias name, ledger name, or a combinations of these in any order. |
|
Show Base Currency |
Displays the values in any factor of numbers – such as in lakhs, in crores, in thousandths, and so on. |
|
Sorting Method |
Sorts the details of the report in different orders – ascending, descending, and so on. |
|
Sort by |
Based on the sorting method select, you can sort the details by different data parameters. |
View Stock Item Details through Monthly Summary | Stock Item Monthly Summary
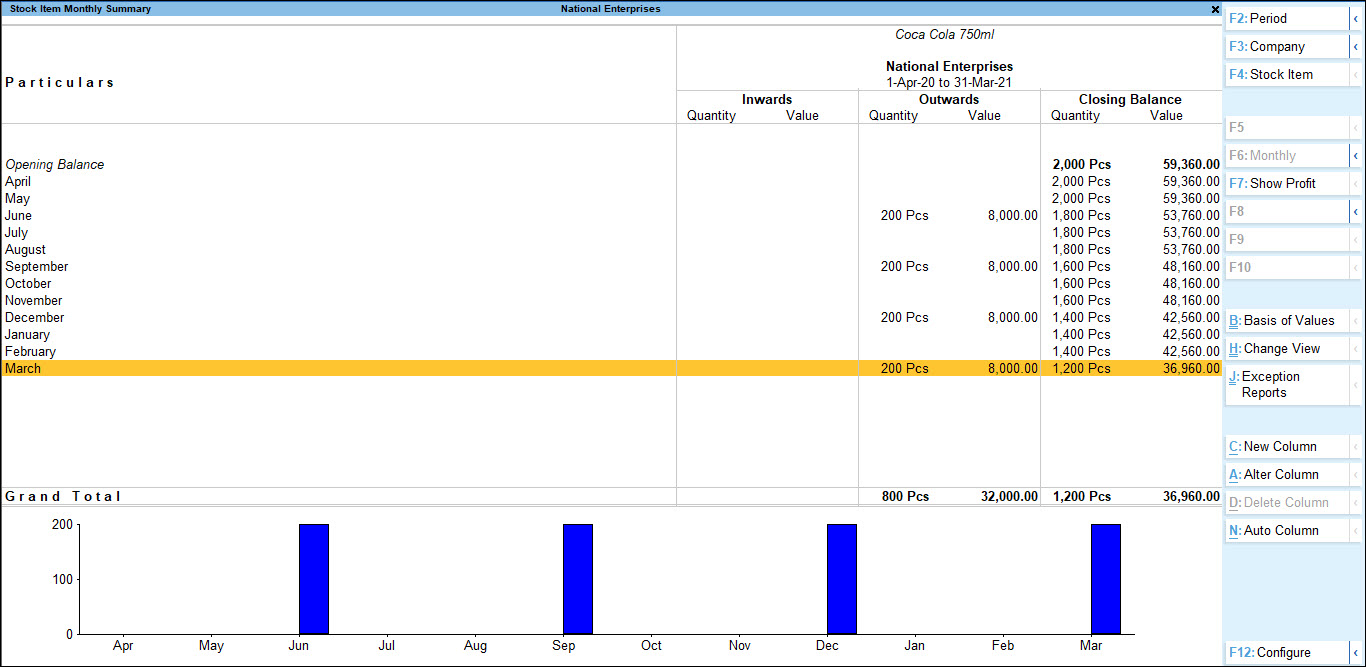
The Stock Item Monthly Summary will show the month-wise inward and outward details along with the closing balance of the selected stock item. You can view the inwards and outwards flow of the stock item for each month, distinctively highlighted in terms of quantity and value. You can also see the graphical representation of movement of stock items across each month, that will give you a fair idea about the difference in stock inflow and stock outflow for each month. From the Stock Item Monthly Summary report, you can drill down to access the Stock Vouchers report. It shows the list of vouchers that include the item viewed in the monthly summary report. It also displays other details, like parties that you have transacted with, the total inward and outward quantities, and the closing values.
![]()
- Drill down from the Stock Summary report at the stock item level to open the monthly summary report.
A sample image of Stock Item Monthly Summary report appears, as shown below.
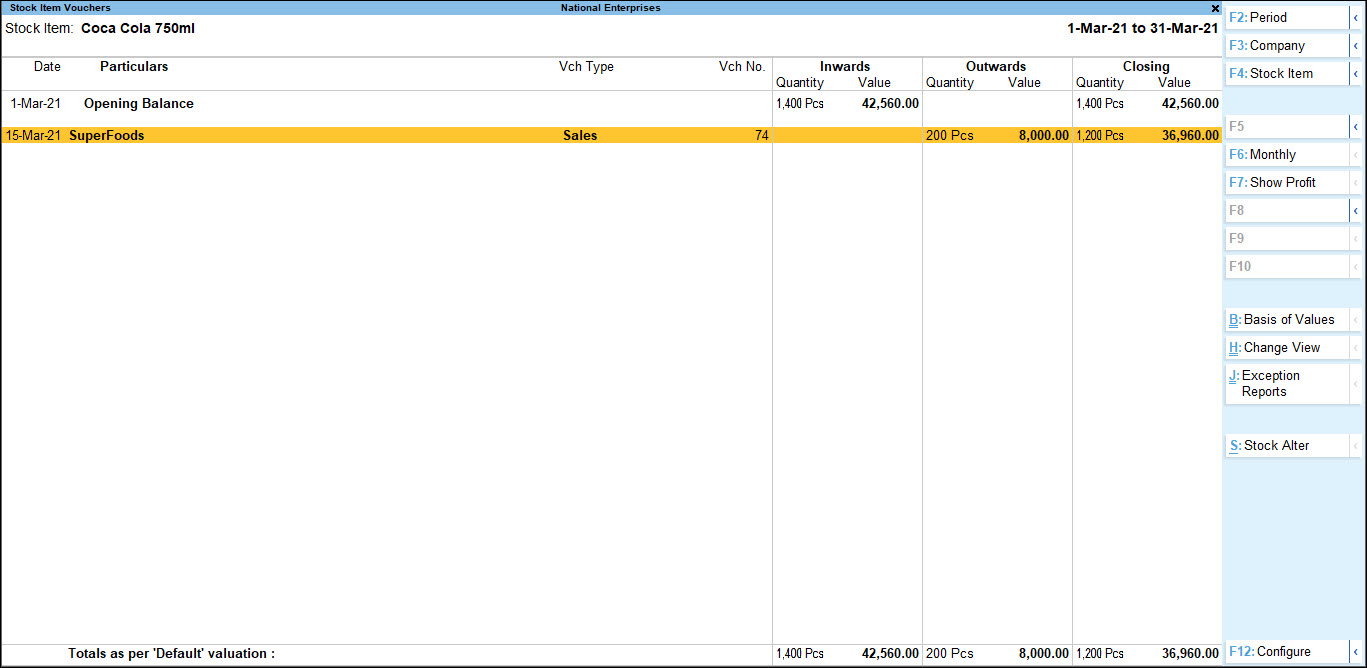
- Drill down from the Stock Item Monthly Summary report on a particular month to open the Stock Vouchers report.
A sample image of Stock Item Vouchers appears, as shown below.
Alter stock item details
- Press Alt+S (Stock Alter) to alter the stock item master for which you are viewing the voucher report.
Like in any other report, press F12 (Configure) or use the buttons on the right button bar to change data representation of the report as you need for your analysis.
Comparison of Data in Stock Summary Report
In TallyPrime, you can compare data for different companies, stock groups, periods, valuation methods, and so on, by adding columns in the reports. For example, if you want to know the value of the stock items you are currently possessing or want to draw a comparison between them in terms of inward flow, outward flow, and closing balances, you can do so in TallyPrime. By analysing the comparison report of stock items in terms of sales, purchases, and closing balances, you can draw a fair conclusion about whether an item stored in your godown is moving fast or slow, most purchased or sold, and so on.
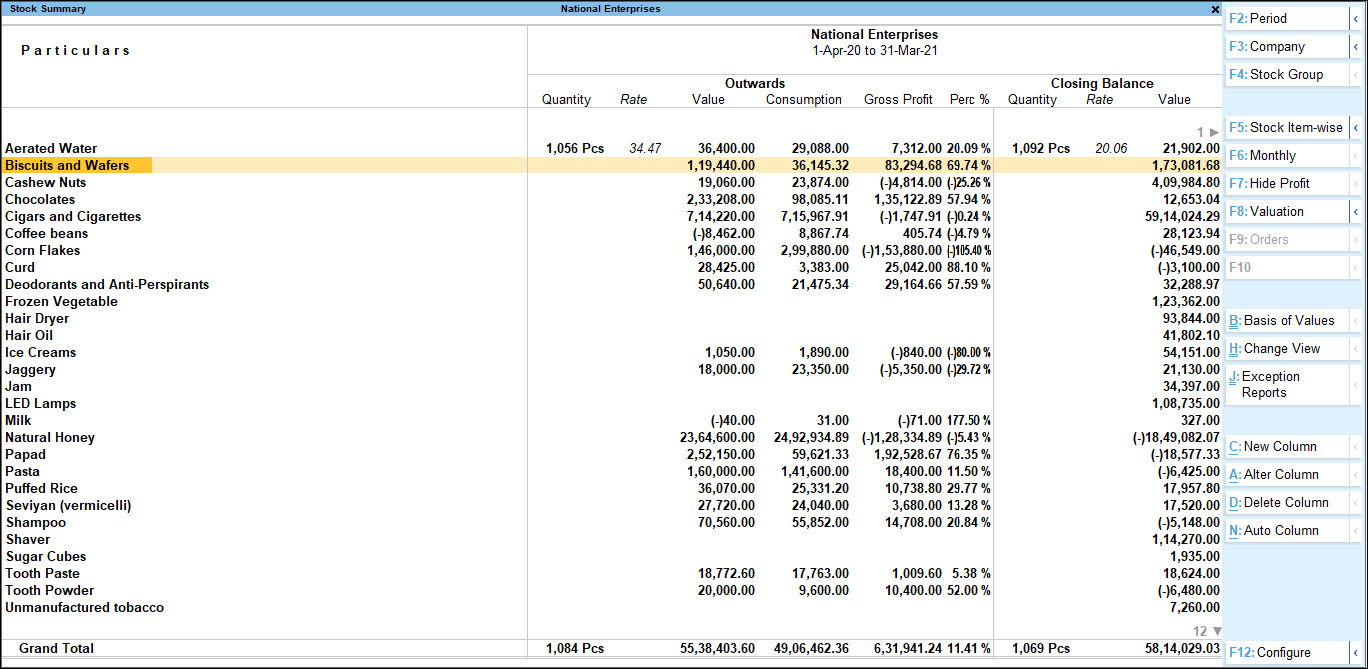
Say you want to compare the closing balance of the stock – under Aerated Water & Biscuits and Wafers.
- You can press Alt+C (New Column) in Stock Summary and select the period to draw a comparison of your stock groups with respect to Quantity, Rate and Value. Repeat this to access data for another month for the same stock group.
A sample image of Stock Summary appears, as shown below:
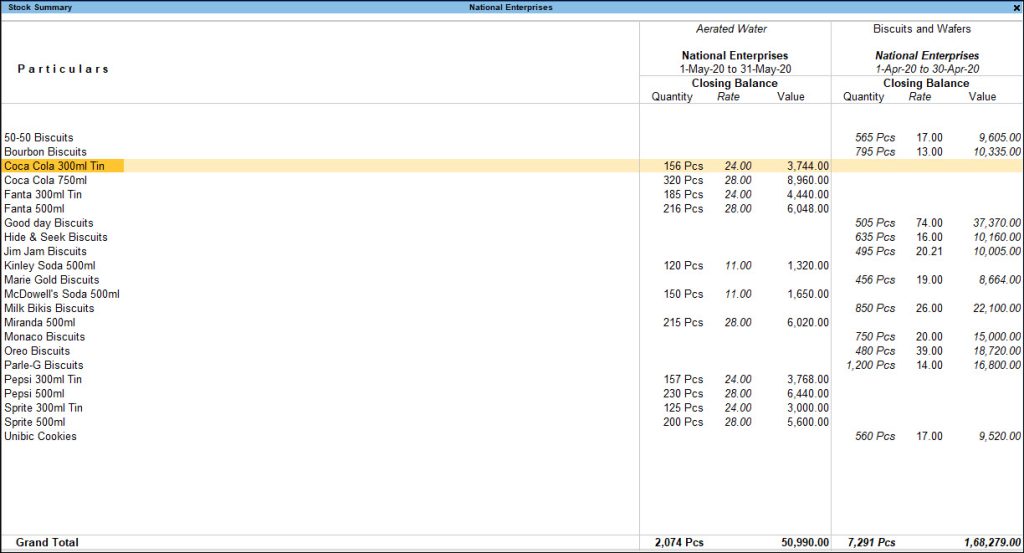
- Press Alt+N (Auto Column) to repeat and compare the data of more than one company or repeat the columns of the current report based on the selected period.
- You can alter a column using Alt+A (Alter Column) and delete a column by pressing Alt+D (Delete Column) from your report.

Know Your Stock Position
Stock position gives you the exact data of your stock items. As you gain a fair idea about the quantity of your stock items, you can accordingly plan if you need to refill the inventory. TallyPrime allows you to know your stock position by knowing the stock in hand or the saleable stock you poses at the moment. You can also know about your pending sales order and purchase orders, in case you need to place an order with your vendors for more stock or you can continue accepting further orders from your customers. Similarly, if you have stored your stock with your third parties or have placed their stock with you, you can know your stock position along with other details, such as their closing balance.
In this section
Stock in hand
![]()
When your customers place a sales order, you may not be sure of the quantity that is available with you. You will also need to check if there are any pending sales orders. In this case, knowing the stock in hand or the saleable stock will be helpful.
- In the Stock Summary report, press F9 (Orders) > select Saleable Stock. If you wish to view the report with due orders only, you can do so by selecting Yes or No and the report will appear.
A sample screen is shown below.
Pending sales orders/purchase orders
Say your customers have placed orders for stock items and you want to know what all orders are pending. In this case:
- Press F9 (Orders) > select Sales Orders Outstanding to view all the pending orders.
Knowing this information will help you decide if you can accept further orders or need to place an order with your vendors for more stock.
At times, you may run out of stock and therefore place the required purchase orders with your vendors.
- Press F9 (Orders) > select Purchase Orders Outstanding.
This helps you to know the status of the orders before you can commit to your customers for any new sales order.
Stock position based on Godown Type
If you transact with different vendors or parties to manage inventory for business needs like consignment sales or job work, you will certainly need to keep a tab on the overall situation. Depending on the business needs, you may have stored your stock with your third parties or their stock with you. You can filter the Stock Summary report to view the stock position.
- Press Ctrl+G (Godown Types) and select an option as needed.
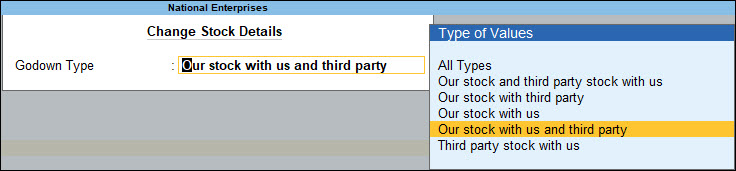
If you have transferred stock to your third party and have maintained a record of the same, on selecting the Our stock with third party option will give you the details of such stock, with their closing balance details.
Assess Value of Stock Items
![]()
Each stock item or a group of stock items may have the same or different valuation methods depending on your business. To be able to assess the replacement value or saleable value of your stock, you will need to apply one or more valuation methods across all the stock and compare the values. You can use the Stock Summary report to view the impact of different methods on the value of the stock. You can also know the profit against different stock values.
Say you want to view the values of stock based on last selling rate of the stock and compare with the current stock value. In the Stock Summary report
- Press Alt+C (New Column) and select Last Sale Price as the Method of stock valuation.
This displays the closing balance of your stock based on the last sale price of the stock items. You can view the profit against this value by pressing F7 (Show Profit).
A sample image is shown below.
Similarly, you can see the stock values and profits calculated for different valuation methods, and understand which valuation method will suit business.
- Press Alt+N (Auto Column) and select Stock Valuation Methods.
To understand more about stock valuation methods and their impact on stock values, refer to the Stock Valuation Methods topic.
Keeping track of stock summary reports is essential for efficient inventory management. Using a stock summary report you can not only analyse your stocks but also implement the other distinctive features provided by TallyPrime as shown in this report for better and effective inventory management.