Movement Analysis in TallyPrime
The stock items in a company are in continuous movement, either inward or outward. The Movement Analysis report provides an insight into the movement characteristics of these stock items. TallyPrime provides you the flexibility of analysing the stock flow in your company with different views. You can view the stock movement as per your requirements like stock item-wise, stock group-wise, stock category-wise, ledger-wise, or account group-wise. However, the report shows the analysis of only those inventory transactions that are integrated with the accounts, such as, inventories that are also recorded in the books of accounts. Inventory vouchers which affect the stock only in quantitative terms are not considered. You can also view the Stock Transfer Analysis which provides you the movement information for each type of Stock Journals. Varied configurations in the report will allow you to view and configure the Movement Analysis report as per your business requirements.
With Movement Analysis in TallyPrime, you can effectively analyse the stock flow in your company. The report provides you with the details of the produced and consumed goods. You can compare the different rates at which parties sell or purchase the goods. If there are any additional costs levied while purchasing certain stock items, the report displays the details of these overhead costs. It helps in finding out the slow-moving items which cause blockages in the flow of the working capital of your company. Not only you will be able to detect which supplier is providing the goods at a cheaper rate but you can also trace the trend of purchases by varied buyers. You can make various decisions for your company based on these findings.
Stock Movement Analysis
Stock Movement Analysis refers to the analysis of the stock items with respect to the procurement process and additional costs incurred (if any). It can be effectively used to analyse the sale or purchase of varied items. You can view the report item-wise, group-wise, or category-wise based on your business requirements. Varied business decisions can be made based on the details generated by these reports such as deciding which item’s rate can be managed effectively by reducing its additional costs or which party can give more competitive rates for the goods. You can analyse the ledger to decide that selling to which party is going to be more profitable for your business. The reports can be viewed and configured in multiple ways in the F12 (Configure) screen.
In this section
Stock Item Movement Analysis
Stock item movement analysis report provides supplier-wise, buyer-wise, and consumption-wise details of stock item movement. You can also view Purchase cost comparison for the item across suppliers and sale value comparison across buyers in this report. If there are any additional costs recorded during the voucher entry, you can view the additional cost details of the particular stock item by enabling the Show Additional Cost Details option. This report enables you to know Inward/Outward Movement of the stock item. It displays the Purchase, Transfers Inward (Production), Sales, and Transfer Outwards (Consumption) of a particular stock item of the stock group selected.
Let’s suppose there are multiple suppliers for a stock item Goodness Corn Flakes and you want to know who is supplying at a better price. You can use the Stock Item Movement Analysis report to make this decision. To view the report,
![]()
- Press Alt+G (Go To) > type or select Stock Item Movement Analysis > and press Enter.
Alternatively, Gateway of Tally > Display More Reports > Statement of Inventory > Movement Analysis > Stock Item Movement Analysis.
- Select or enter the Name of Item from the List of Items.
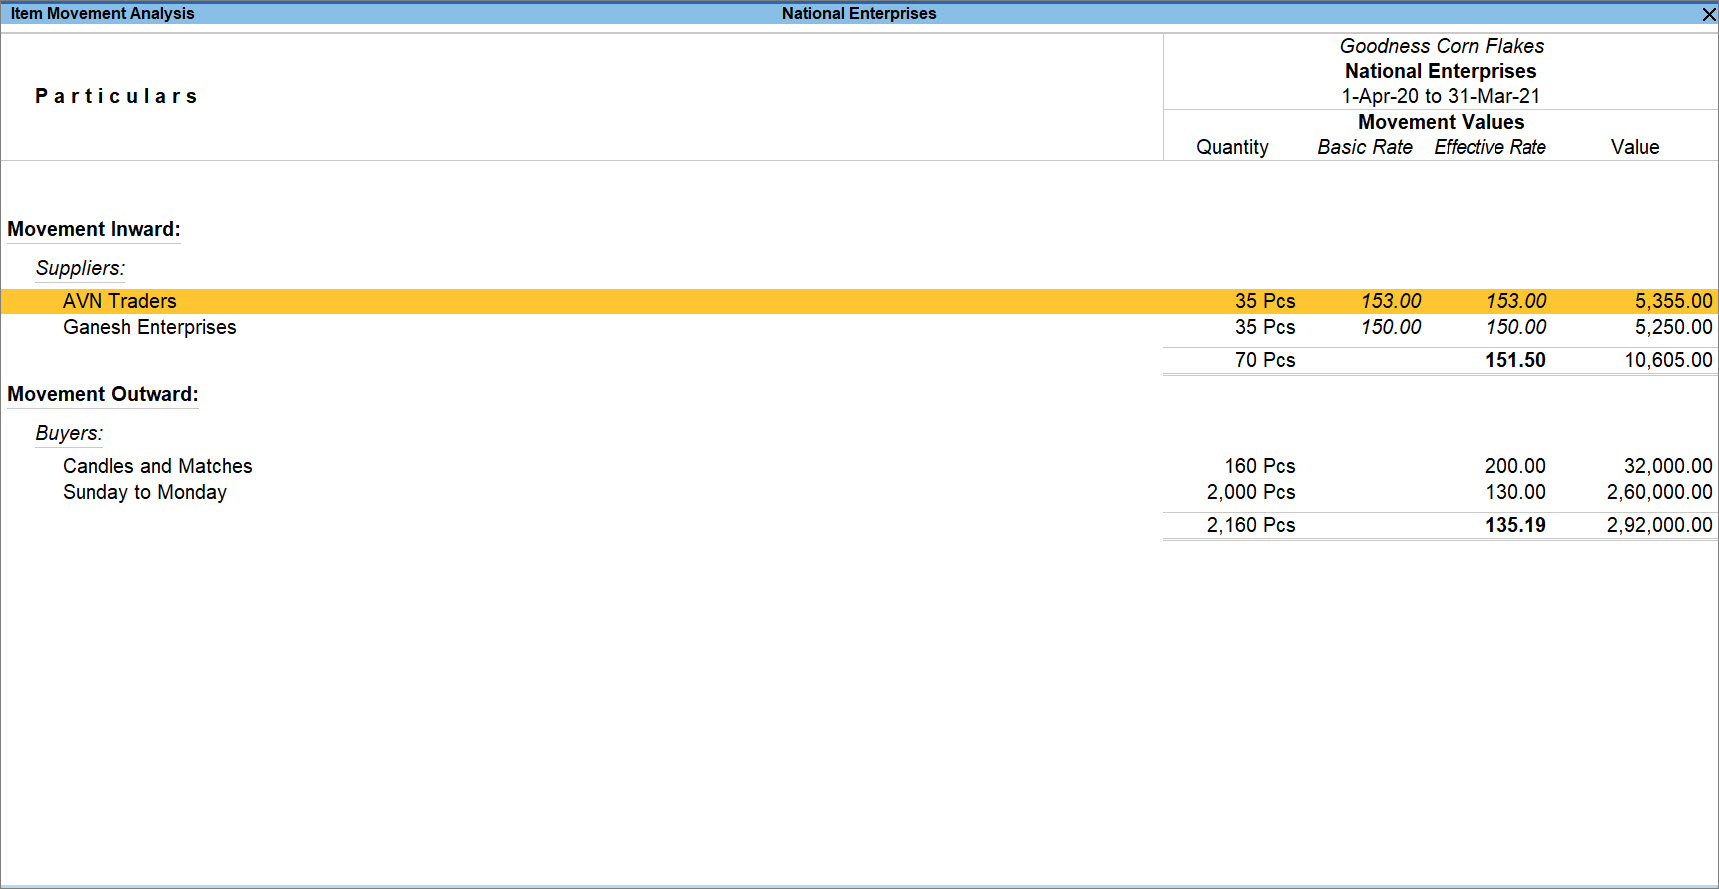
A sample image of the Item Movement Analysis screen appears, as shown below:
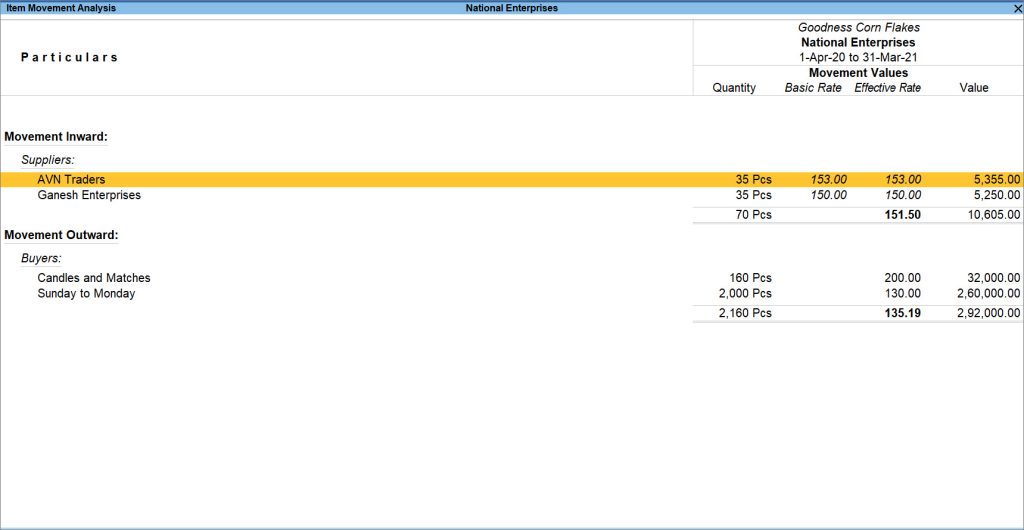
By default, the Item Movement Analysis report displays the following:- Quantity: The quantity of stock items moving inward or outward.
- Basic Rate: The rate at which an item is sold or purchased.
- Effective Rate: The final landed cost of the items after considering all the overhead costs.
- Value: The total value of the respective stock item.
- Movement Inwards: The inward flow (Production)of the stock items, under which the all the Suppliers are listed.
- Movement Outwards: The outward flow (Consumption) of the stock items, under which all the Buyers are listed.
In the F12 (Configure) screen, you can enable or disable the options according to your need in the Item Movement Analysis report.Details of Quantity and Effective Rate will be displayed in the report only if the Can Quantities of Items be Added option is enabled in the Stock Item Master.
- To view transaction level details of the item, select the required ledger and press Enter.
The Item Voucher Analysis screen appears displaying the transaction details. You can drill down further to obtain more details by pressing Enter.
Varied configurations in the F12 (Configure) screen in the Item Voucher Analysis report provides you with the flexibility of viewing the report as per your requirements, namely:
- Show Godown Details: Enable this if you wish to display the Godown location details in the report.
- Format of Report: You can alter the format of the report to view it in the condensed or detailed mode. When the Item Movement Analysis report is in the detailed format, you can choose to display the narration of the vouchers by enabling the Show Narrations option. And in case you want to display the additional description of the particular stock item, enable the Show Description for Stock Item option.
- Display Name for Ledgers: Enabling the option will display the name of the ledger in the report.
You can display the details of a report in different views with additional details or for a specific period. You can also view other reports related to the current report such as Stock Query, Monthly Summary, Voucher Details and Cost Analysis in the Change View (Ctrl+H) section of the Item Movement Analysis report. For instance, if you want to view the Monthly Summary of the selected stock item,
- In the Item Movement Analysis report, press Ctrl+H (Change View) > type or select Monthly Summary > press Enter. Press Esc to view the default report.
To know more about reports, refer to Working with Reports in TallyPrime topic.
Stock Group Movement Analysis
This report shows the details of inward and outward transactions carried out for all the stock items in a group. If you want to view all the stock items under a specific group together instead of viewing them individually, you can use the Stock Group Movement Analysis. It displays the total inward and outward movement of all the items in a selected Stock Group in your company. The quantities displayed are Actual Quantities in movement (which, in some cases, may be different from the Billed Quantity in the transactions.)
Let’s suppose you want to know which is the most sold item under a particular stock group. To view the Stock Group Movement Analysis report,
![]()
- Press Alt+G (Go To) > type or select Stock Group Movement Analysis.
Alternatively, Gateway of Tally > Display More Reports > Statement of Inventory > Movement Analysis > Stock Group Movement Analysis.
- From the List of Stock Groups, select the required Group and press Enter.
A sample image of the Stock Group Analysis screen appears, as shown below:
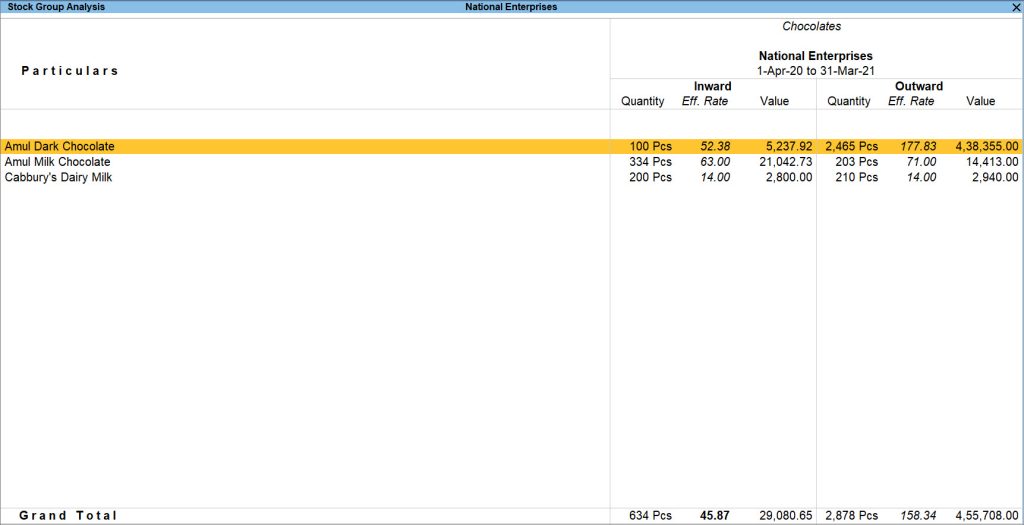
You can view the ledgers created under the group, with details of inward and outward movement of stock. By default, the Stock Group Analysis displays the following:- Inwards: The inward flow (Production) of the stock items, under which Quantity, Effective Rate and Value of the stock items flowing inwards are listed.
- Outwards: The outward flow (Consumption) of the stock items, under which Quantity, Effective Rate and Value of the stock items flowing outwards are listed.
- Quantity: The quantity of stock items moving inward or outward.
- Effective Rate: The final landed cost of the items after considering all the overhead costs.
- Value: The total value of the respective stock item.
In the F12 (Configure) screen, you can enable or disable the options according to your need in the Item Movement Analysis report.
- Group By: You can view the movement analysis based on the Ledger or Stock Item.
- Type of Grouping: If you opted to view the details based on stock item, you can choose to see the stock items in a list or stock group-wise.
- Format of Report: You can select the format Condensed or Detailed to view the report.
- Expand all levels in Detailed format: On selecting the above option Format of Report as Detailed, the option is available to expand all levels of report in detailed format.
- Sorting Method: You can sort the details in the report based on Quantity, Rate, Value, Stock Item name, and so on. You can also apply a suitable sorting method by selecting from the Sorting Methods table and do Amount-wise, Quantity-wise and Rate-wise sorting either by the Inwards column or the Outwards column. This can be selected from the Sort By field.
- Select a ledger and press Enter to view the stock items purchased or sold.
This will also help you in analysing business aspects such as which suppliers are providing items at a better price or which buyers are purchasing more. - In Item Voucher Analysis report, select the ledger and press Enter to view the purchases/sales details.
You can drill down further for more details.

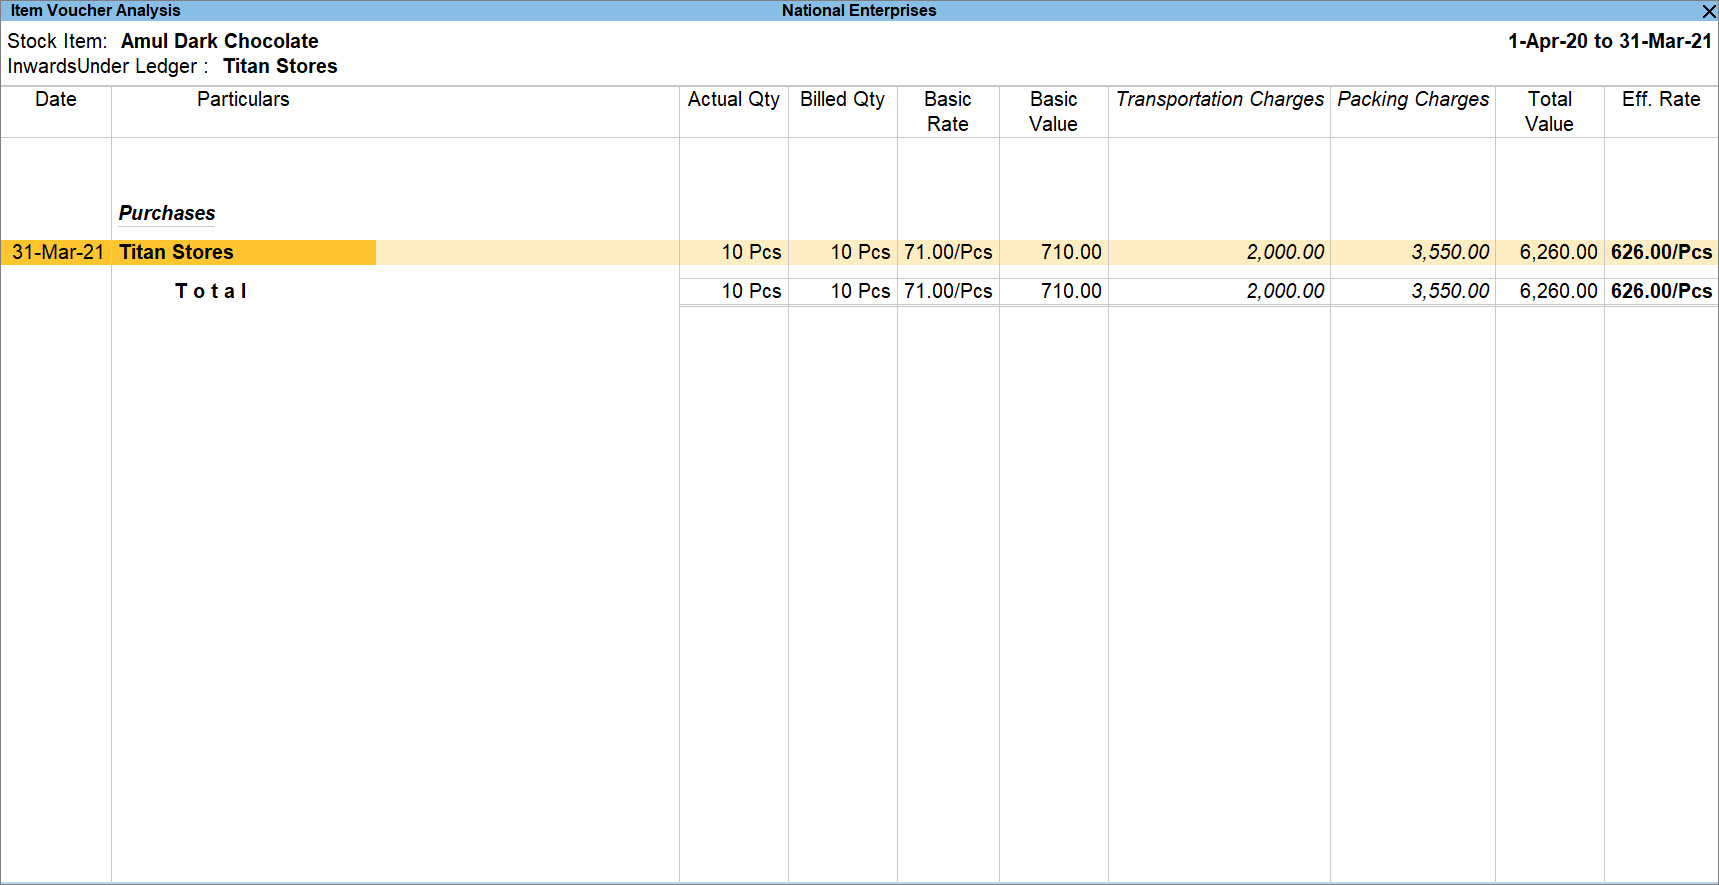
You can view Item Voucher Analysis report and configure it in varied ways, based on your requirements. The default screen displays the additional costs (if any) in a single column. Let’s assume that you have made purchases from the same party and additional costs were levied while purchasing the item such as transportation costs, packing charges, or freight charges. With the Item Voucher Analysis report, you will be able to view the bifurcation of additional costs and its details.
- In the F12 (Configure) screen, set Show Additional Cost Details to Yes.

You can view the Stock Group Analysis report ledger-wise or stock item-wise, depending on your business requirements by selecting the desired view in the Change View (Ctrl+H) section. Various reports related to Stock Group Analysis such as Monthly Summary, Ageing Analysis, Cost Analysis and Cost Estimates are also available in this section.
For instance, if you wish to analyse the ageing of the goods in a current period,
- In the Stock Group Analysis, press Change View (Ctrl+H) > Ageing Analysis and view the ageing of the items under the selected Stock Group.
To know more about reports, refer to Working with Reports in TallyPrime topic.
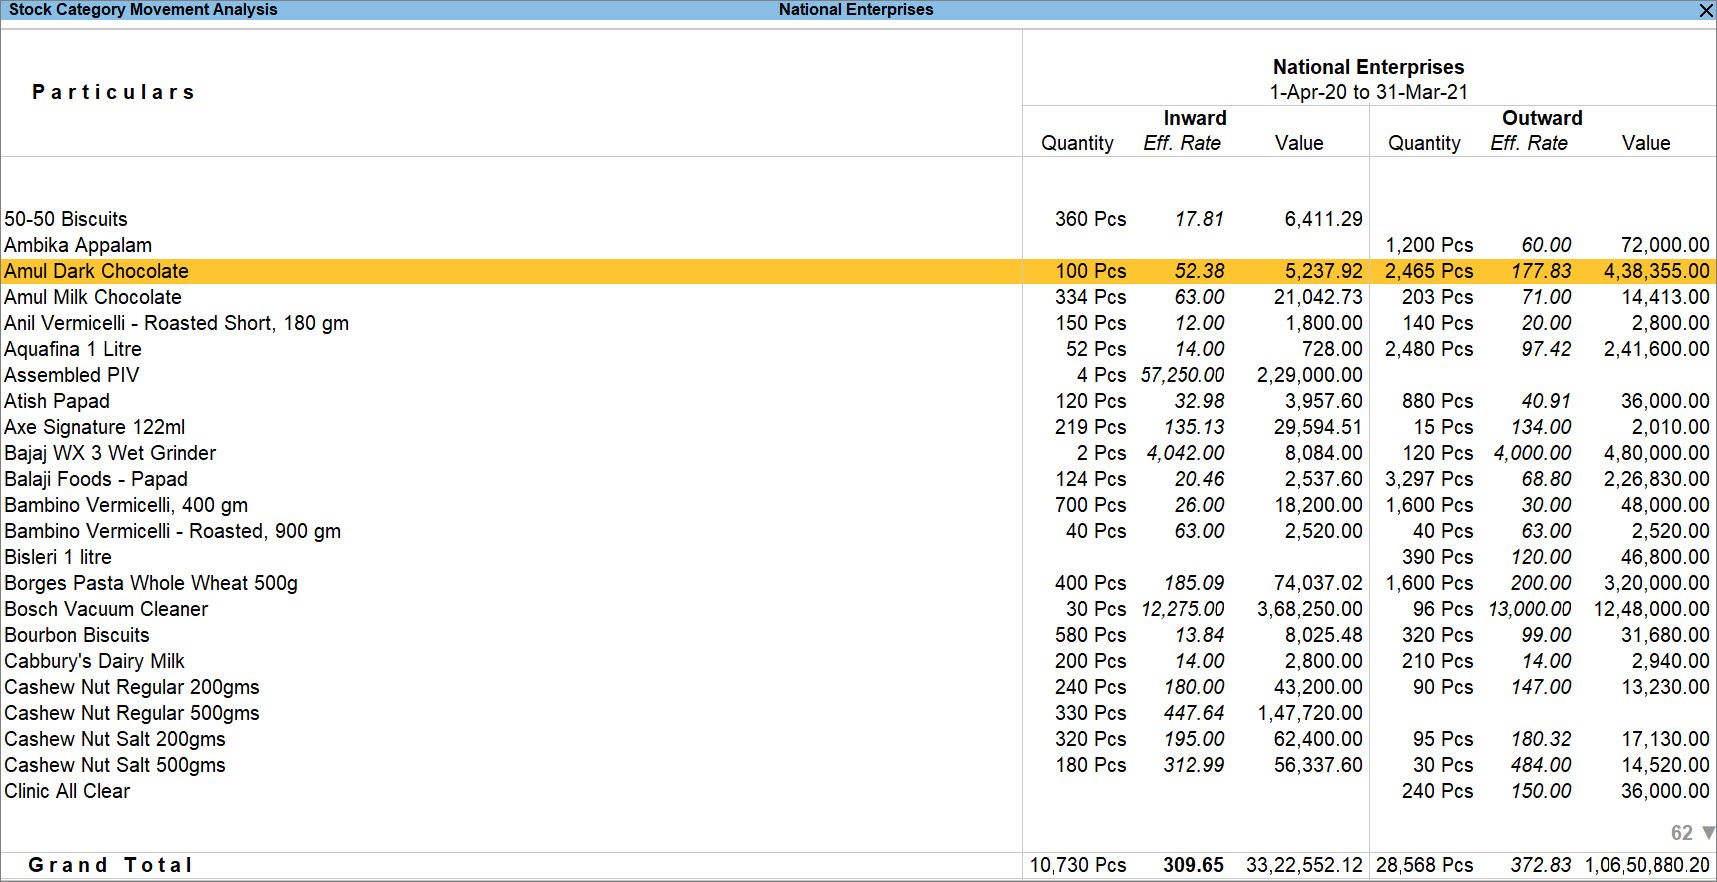
Stock Category Movement Analysis
The report displays the inward and outward movement details of the stock items. After selecting a stock category from the List of Categories, the Stock Category Analysis report displays information relating to Quantity, Effective Rate, and Value under separate columns for inward and outward movement of goods.
To know more about the stock groups and stock categories, refer to How to Manage your Stock Items in TallyPrime topic.
Suppose you want to know if the Consumption of a particular stock item is more than its Production or vice-versa, you can view the Stock Category Movement Analysis report and analyse the same. To view the report,
![]()
- Press Alt+G (Go To) > type or select Stock Category Movement Analysis > and press Enter.
Alternatively, Gateway of Tally > Display More Reports > Statement of Inventory > Movement Analysis > Stock Category Movement Analysis. - From the List of Categories, select the required Category and press Enter.
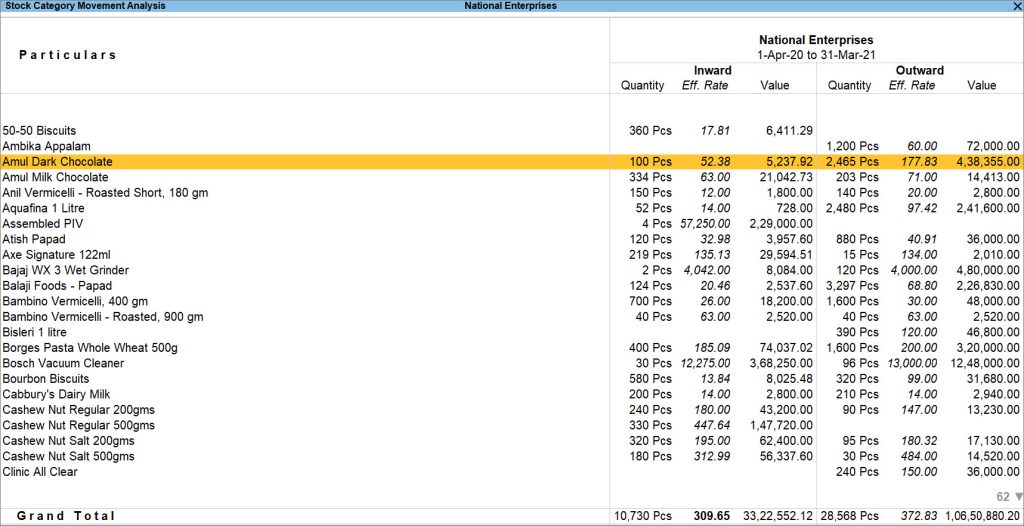
The Inward and Outward details of the stock items are displayed under two columns where you will be able to determine if the inward quantity of a stock item is more than the outward quantity.
By default, the Stock Category Movement Analysis displays the following:- Inwards: The inward flow (Production) of the stock items, under which Quantity, Effective Rate and Value of the stock items flowing inwards are listed.
- Outwards: The outward flow (Consumption) of the stock items, under which Quantity, Effective Rate and Value of the stock items flowing outwards are listed.
- Quantity: The quantity of stock items moving inward or outward.
- Effective Rate: The final landed cost of the items after considering all the overhead costs.
- Value: The total value of the respective stock item.
In the F12 (Configure) screen, you can enable or disable the options according to your need in the Item Movement Analysis report.- Show using Alternate Units: If a stock item has alternate units defined, then on setting this option to Yes, the alternate units of the stock item will be displayed in the column Alt. Units.
- Group By: You can view the movement analysis based on the Ledger or Stock Item.
- Type of Grouping: If you opted to view the details based on stock item, you can choose to see the stock items in a list or stock group-wise.
- Format of Report: You can select the format Condensed or Detailed to view the report.
- Expand all levels in Detailed format: On selecting the above option Format of Report as Detailed, the option is available to expand all levels of report in detailed format.
- Display name for Stock Items: By default, only the stock item name will be displayed in the report. A different display name style can be selected from this field.
- Display name for Stock Categories: From this field, the style of displaying the ledger names in the report can be changed.
- Sorting Method: The details in the report can be sorted based on Quantity, Rate, Value, Stock Item name, and so on. A suitable sorting method can be applied by selecting from the Sorting Methods table. Amount-wise, Quantity-wise and Rate-wise sorting can be done either by the Inwards column or the Outwards column. This can be selected from the Sort By field.
- Select the required stock item and press Enter to drill-down to display the Item Movement Analysis.
Movement Analysis of Stocks through Groups and Ledgers
You can choose to analyse the movement of goods ledger-wise or group-wise. This will enable you to make detailed decisions based on a category-wise Movement Analysis. Similar data can be viewed from the perspective of debtors and creditors. You can determine the trend of sales and purchases based on your selection. Group Analysis of the report will provide you the information of the goods under a particular Account Group (Debtors/Creditors/Bank Accounts). Similarly, ledger-analysis enables you to get ledger-wise details of the Account Group.
In this section
Group Analysis
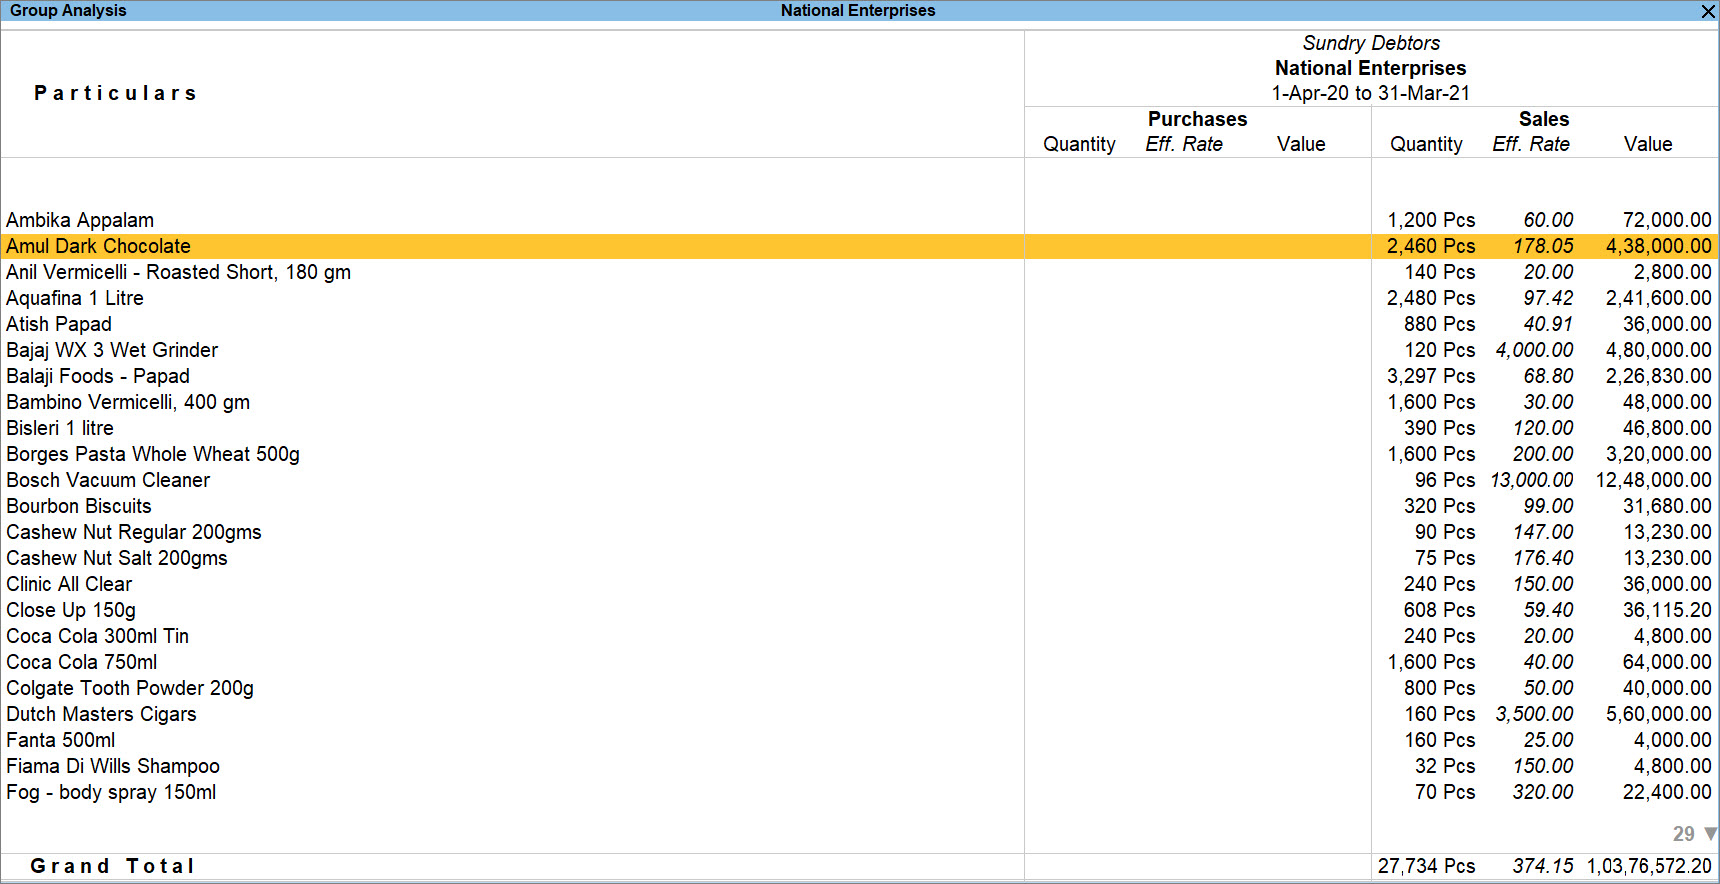
Group Analysis report contains information about Items transacted in Vouchers for the Ledgers created under the selected Group. Let’s suppose you want to analyse the different stock items that you deal in, with various parties under an account group, you can do so by viewing the Group Analysis report. It will provide you a detailed information about the various parties under the specific group who deal with the selected stock item. To view the Group Analysis report,
![]()
- Press Alt+G (Go To) > type or select Group Analysis.
Alternatively, Gateway of Tally > Display More Reports > Statement of Inventory > Movement Analysis > Group Analysis.
- Select the required group from the List of Groups.
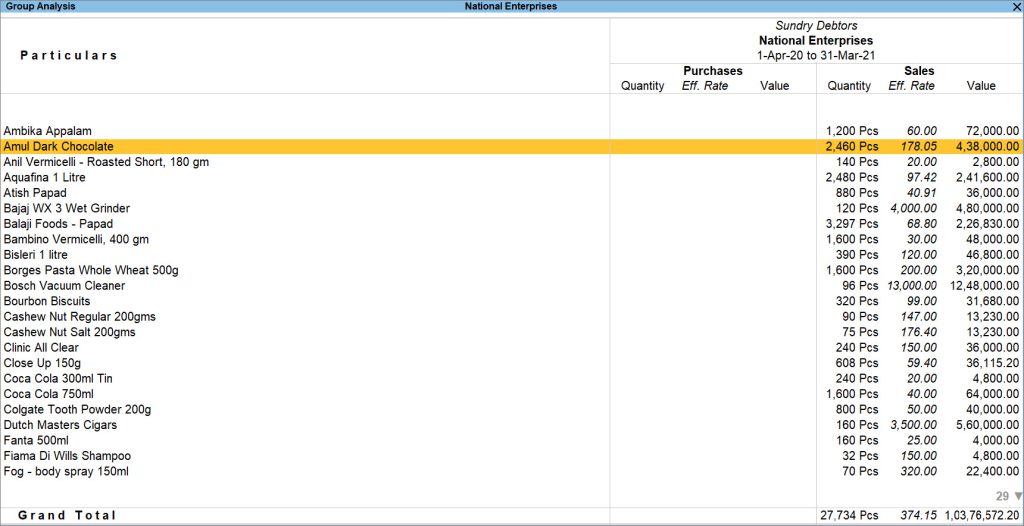
The Group Analysis report displays information regarding the selected group (Sundry Debtors, in this case). You will be able to view all the items that the group has purchased.
By default, the Group Analysis displays the following:- Purchases: The inward flow (Production) of the stock items, under which Quantity, Effective Rate and Value of the stock items flowing inwards are listed.
- Sales: The outward flow (Consumption) of the stock items, under which Quantity, Effective Rate and Value of the stock items flowing outwards are listed.
- Quantity: The quantity of stock items moving inward or outward.
- Effective Rate: The final landed cost of the items after considering all the overhead costs.
- Value: The total value of the respective stock item.
In the F12 (Configure) screen, you can enable or disable the options according to your need in the Item Movement Analysis report.
- Show using Alternate Units: If a stock item has alternate units defined, then on setting this option to Yes, the alternate units of the stock item will be displayed in the column Alt. Units.
- Display name for Stock Items: By default, only the stock item name will be displayed in the report. A different display name style can be selected from this field.
- Sorting Method: The details in the report can be sorted based on Quantity, Rate, Value, Stock Item name, etc. A suitable sorting method can be applied by selecting from the Sorting Methods table. Amount-wise, Quantity-wise and Rate-wise sorting can be done either by the Inwards column or the Outwards column. This can be selected from the Sort By field.
- Select the required stock item from the list to further drill-down.
The Item Voucher Analysis screen appears listing the different parties under the Sundry Debtors group who are dealing in Amul Dark Chocolates. Other information relating to Quantity, Effective Rate and Value of the item (Amul Dark Chocolates in this case) are displayed under separate columns for the group (Sundry Debtors).
You can drill-down further for transaction-level information.
Ledger Analysis
Ledger Analysis is similar to Group Movement Analysis, where you can view the sales and purchases of stock items involving the selected ledger. You can view the details of the selected ledger and use it to make decisions such as repeated purchase. If you want to determine the varied stock items you have acquired from a particular party, you can do so by viewing the Ledger Analysis report.
![]()
- Press Alt+G (Go To) > type or select Ledger Analysis > and press Enter.
Alternatively, Gateway of Tally > Display More Reports > Statement of Inventory > Movement Analysis > Ledger Analysis. - Select the required Ledger from the List of Ledgers.
A sample image of the Ledger Analysis screen appears, as shown below:
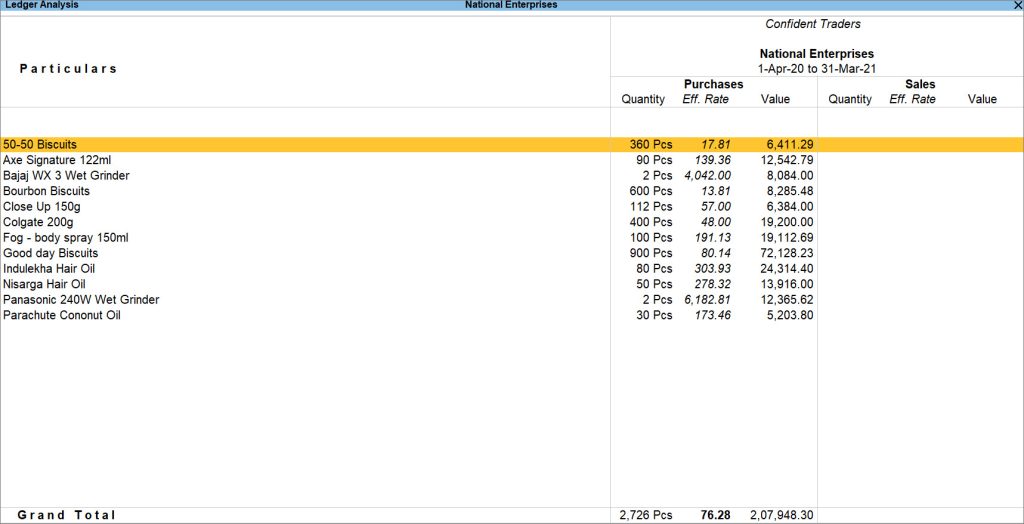
By default, the Ledger Analysis displays the following:- Purchases: The inward flow (Production) of the stock items, under which Quantity, Effective Rate and Value of the stock items flowing inwards are listed.
- Sales: The outward flow (Consumption) of the stock items, under which Quantity, Effective Rate and Value of the stock items flowing outwards are listed.
- Quantity: The quantity of stock items moving inward or outward.
- Effective Rate: The final landed cost of the items after considering all the overhead costs.
- Value: The total value of the respective stock item.
In the F12 (Configure) screen, you can enable or disable the options according to your need in the Item Movement Analysis report.- Show using Alternate Units: If a stock item has alternate units defined, then on setting this option to Yes, the alternate units of the stock item will be displayed in the column Alt. Units.
- Display name for Stock Items: By default, only the stock item name will be displayed in the report. A different display name style can be selected from this field.
- Sorting Method: The details in the report can be sorted based on Quantity, Rate, Value, Stock Item name, etc. A suitable sorting method can be applied by selecting from the Sorting Methods table. Amount-wise, Quantity-wise and Rate-wise sorting can be done either by the Inwards column or the Outwards column. This can be selected from the Sort By field.
- Select the required stock item from the list to further drill-down to transaction level details.
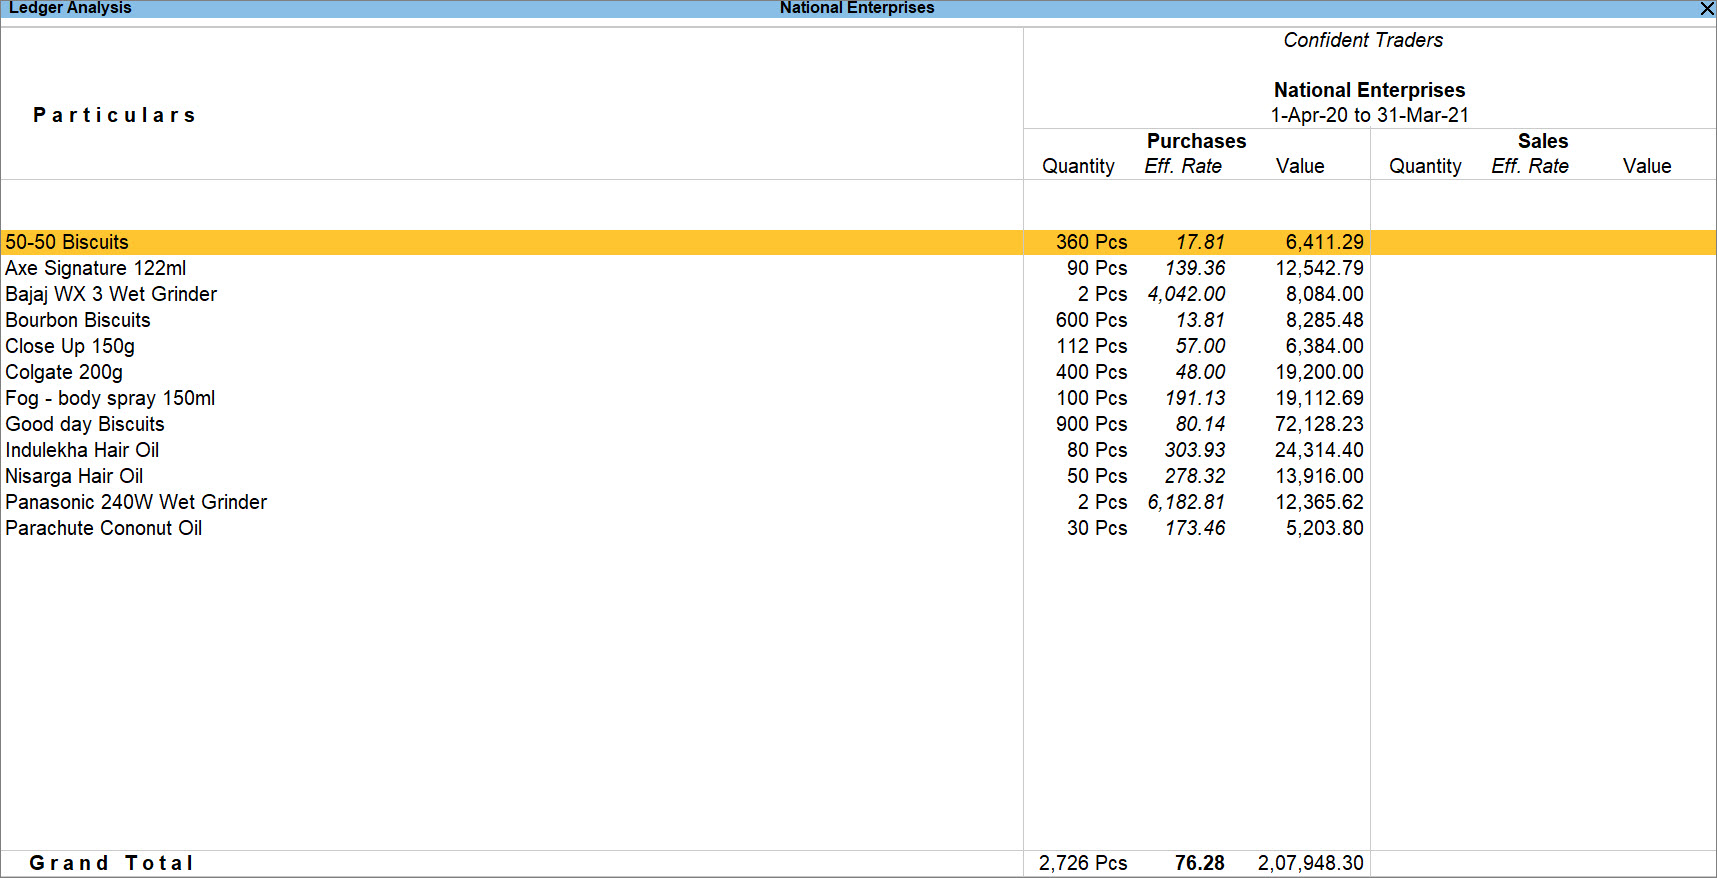
This report contains information about the items which are transacted in sales and purchase vouchers for the selected ledgers. When you select an account ledger (Debtor/Creditor/Cash/Bank) for the Ledger Analysis report, the sale and purchase of all the items, affecting the selected ledger, will be displayed in this report.
Stock Transfer Analysis
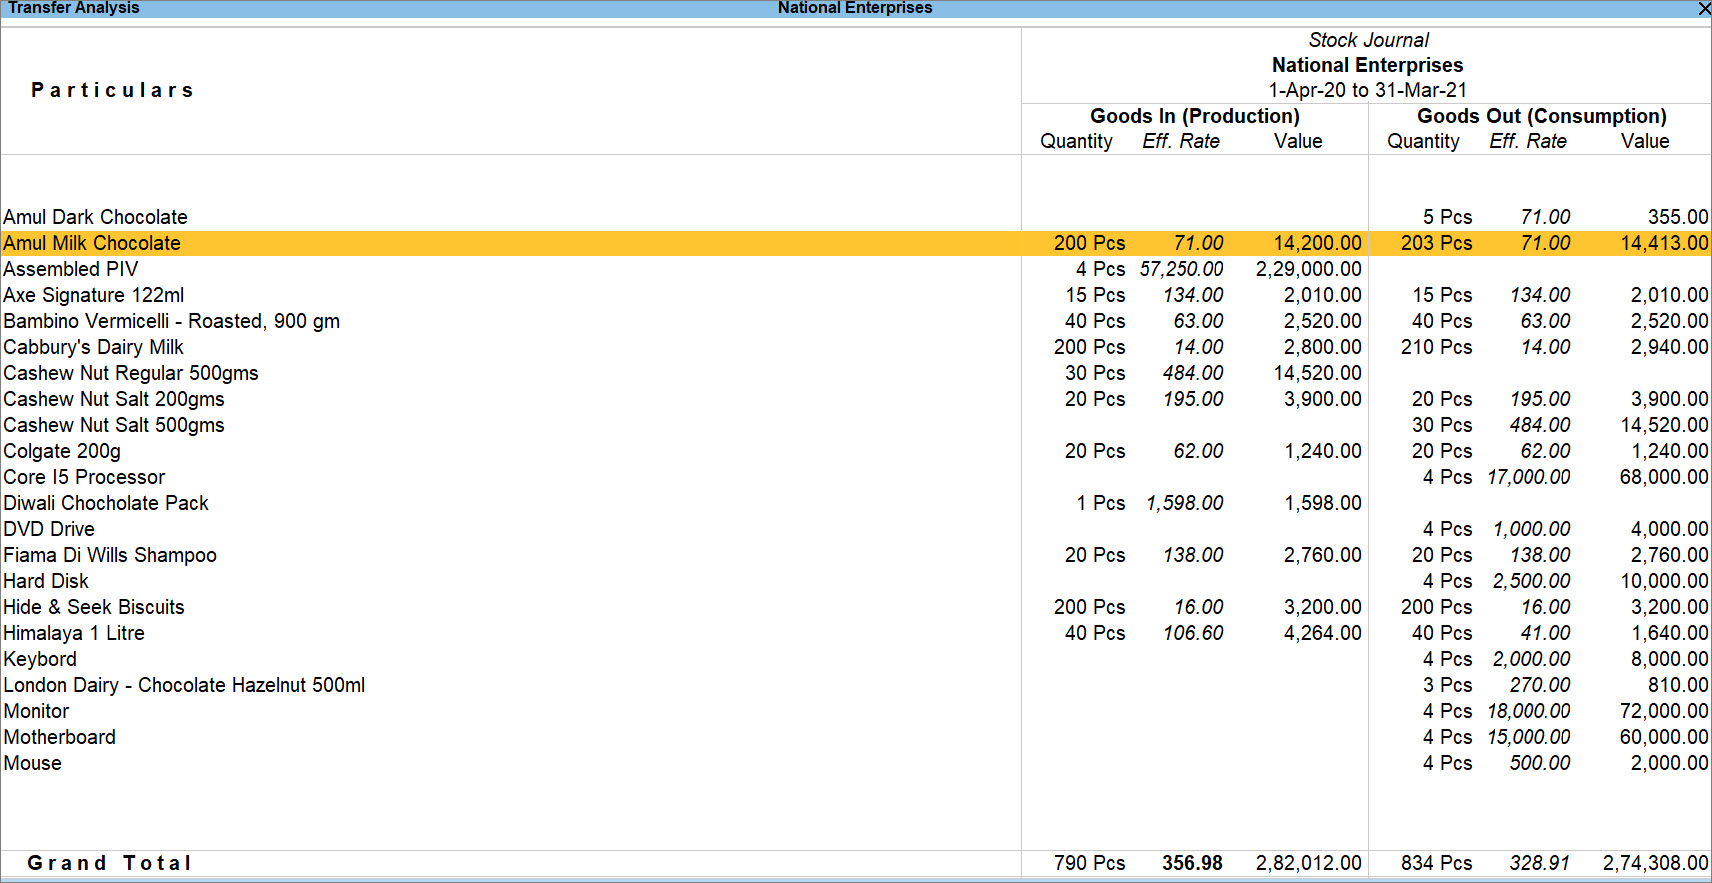
When using different stock journals for each transaction, Transfer Analysis gives the movement details for each type of stock journal. This report displays information about the items which are transacted in the stock journal voucher. Generally, in stock journal voucher, movement of goods, manufacture of goods or inter-Godown transfer is recorded.
This is a very useful costing and waste analysis tool. In non-manufacturing setups, which have multiple Godowns, this report is a quick checkpoint to verify that all transfer entries have been entered correctly. This report will also help you determine whether you have made both sales and purchases with a given company.
Goods that are moving inwards through stock journal/manufacturing journal voucher type fall under Production whereas goods that are moving outwards through these voucher types fall under Consumption. Let’s say you want to determine the total number of a particular stock item moving outwards from your company. You can go to the Stock Transfer Analysis report to view these details. To view the report,
![]()
- Press Alt+G (Go To) > type or select Transfer Analysis.
Alternatively, Gateway of Tally > Display More Reports > Statement of Inventory > Movement Analysis > Transfer Analysis.
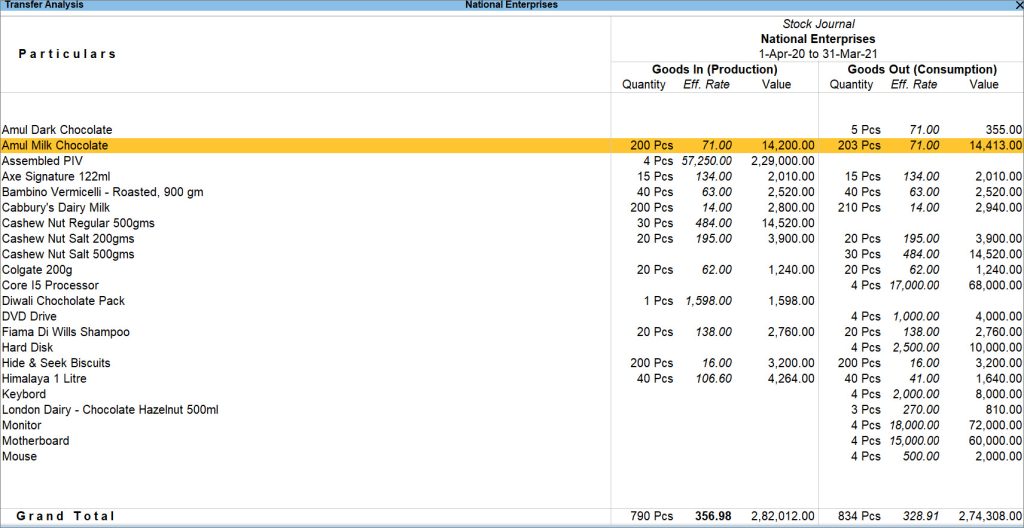
By default, the Transfer Analysis report displays the following: - Goods In (Production): Goods which are inwards through stock journal will be displayed here.
- Goods Out (Consumption): Goods which are outwards through stock journal will be displayed here.
- Quantity: The quantity of stock items moving inward or outward.
- Effective Rate: The final landed cost of the items after considering all the overhead costs.
- Value: The total value of the respective stock item.
In the F12 (Configure) screen, you can enable or disable the options according to your need in the Transfer Analysis report.
- Display name for Stock Items: By default, only the stock item name will be displayed in the report. A different display name style can be selected from this field.
- Sorting Method: The details in the report can be sorted based on Quantity, Rate, Value, Stock Item name, and so on. A suitable sorting method can be applied by selecting from the Sorting Methods table. Amount-wise, Quantity-wise and Rate-wise sorting can be done either by the Inwards column or the Outwards column. This can be selected from the Sort By field.
TallyPrime’s Movement Analysis Report is used for studying and comparing an organization’s stock flow characteristics. It gives the user an insight into the movement of goods within an organization.