Measure the Performance of your TDL Code Snippet Using Profiler
Profiler is a very useful tool for programmers. TDL Profiler helps you to analyze and optimize your TDL code. The performance of the code snippet can be obtained using TDL profiler. The profiler provides information such as the time taken to evaluate a TDL artefact, the number of times the TDL artefact was executed and so on. The TDL artefact may be an expression, function, collection, remote call, a view change, or a Report/Form regeneration.
Profile an Operation
- Open TallyPrime in Developer mode.
- In the calculator panel, type the following commands.
Mode: Profile
Start
<Perform the operation which needs to be profiled>
Stop
Dump
Open
- The log file opens.
The commands are case insensitive.
- The log file format is supported from Tally.ERP 9 Release 6.5.3 onwards.
The log file contains 3 sections:
Call Graph
This section details the order of execution of the TDL artefacts. In this section, a TDL artefact appears as many times as it was executed.
|
Column Title |
Description |
|
Exec. Order |
This column gives the order in which the TDL artefacts were executed after the profiler started. In the image below, the TDL artefact MyLedgerentriesSummary was the first one to execute which in turn called the collection MyVouchersCollection , hence the order of execution was 1 and 2 respectively. |
|
Depth |
This number indicates the level at which the TDL artefact was executed within a hierarchy or a block of code. For example, in the image below, MyLedgerentriesSummary was executed at Level 0 followed by MyVouchersCollection at Level 1. |
|
Total Time |
The total time taken to execute the TDL artefact along with its children |
|
Self Time |
The time taken to execute the TDL artefact itself (excluding the time taken to execute its children). |
|
Requestor Type/Requestor Name |
The context in which the TDL artefact was executed. In the image below, the collection MyLedgerentriesSummary was invoked by the part DashBoardLedgerAmount and hence this is the Requestor for the TDL artefact MyLedgerentriesSummary . |
|
TDL Artefact Type/TDL Artefact Name |
The TDL artefact that is being profiled. |
|
Result |
This applies to only TDL expressions and contains the result of its evaluation. |
Grouped by Parent Hierarchy
The data in this section is grouped based on the Parent Hierarchy. For example, if a TDL artefact appears more than once under a parent hierarchy, then the data of the TDL artefact is grouped.
The columns Depth, Requestor Type, Requestor Name, TDL Artefact type, TDL Artefact Name together uniquely identify a parent. Each subsequent depth represents a child of the current depth.
The count represents the number of times the TDL artefact was executed and Failed Count represents the number of times the TDL artefact failed during execution.
Grouped by TDL Artefacts
The data in this section is grouped by the TDL artefacts. Here each TDL artefact appears only once.
The steps to get the profiler information are:
- Start the Profiler
- Execute the desired Report
- Dump the Profiler and/or Stop the Profiler, with the file name
The dumped profiler information when opened in Textpad, is as shown below:
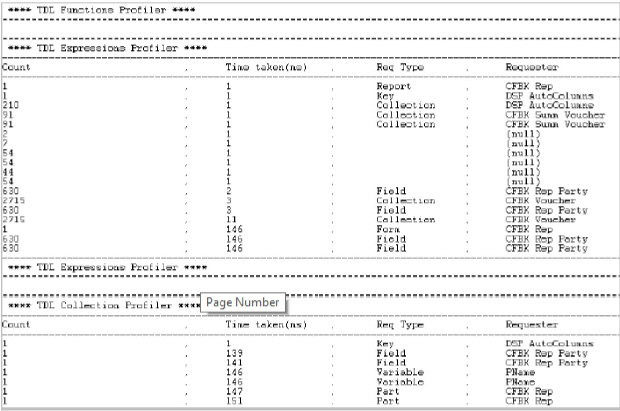
As seen in the figure, the profile information shows the time taken for evaluating every expression as well as how many times (Count) the same expression or collection was evaluated/ gathered.
Developers are already aware that apart from performing various arithmetic operations, Calculator Panel can also be used to issue select Queries like Select $Name, $Parent from Ledger, Select * from Company, etc. Now, the Calculator Pane can also be used by developers for Profiling, Debugging, Key Recording and Playing back by setting various modes.
Commands Used for Profiling
The following Calculator Pane Commands are supported for the profiling information:
Profiler Mode
It sets the mode to Profiler, which means that Profiling Commands will be accepted. It provides certain calculator pane commands to the developer in order to check the performance of code.
Syntax
MODE: Profile
Once the mode is set to Profile, commands issued in the Calculator Pane work in Profiling Context.
Start
This command starts gathering the count and time taken for evaluating a TDL Artefact in memory.
Syntax
START
Stop
This command is used to end the profiling.
Syntax
STOP
Dump
This command is used to dump the collected profile data to the file tdlprof.log . This also clears the memory once the data is dumped.
Syntax
DUMP
Dumpz
This command is used to dump the collected profile data, including artefacts which have consumed negligible time, i.e., zero processing time, into the file tdlprof.log. It also clears the memory after update to the file.
Syntax
DUMPZ
Status
It checks the status of the profiler, and returns the statement Profiler is ON or Profiler is OFF.
Syntax
STATUS
Reset
This command is used to clear the existing profile data from the Memory.
Syntax
RESET
Help
This command gives the list of Profiler commands, with a description of their purpose.
Syntax
HELP
Actions Used for Profiling
Apart from Calculator Pane Commands, there are several other TDL Actions provided, to programmatically execute the profiling operations. They are:
Action – Start Profile
This action is used to start profiling. The count, time taken and other useful information of every function, collection, etc. gathered along with expressions within the report, are profiled in memory.
Syntax
Start Profile
Example:
[Button : Start Profiling]
Key : Alt + S
Action : Start Profile
Action – Dump Profile
This action is used to dump all the profiled information to the file. It also clears the memory after dumping the information.
Syntax
Dump Profile [: <File Name>[: <Logical Value>]]
Where,
<File Name> is the name of the file to which the information has to be written. In the absence of the ‘File Name’ Parameter, the default file updated will be tdlprof.log
<Logical Value> if set to YES, the ‘Dump Profile’ action also includes zero time-taking artefacts. If it is enabled, the action is similar to calculator pane command DumpZ, else it is similar to Dump.
Example
[Button: Dump Profiling]
Key : Alt + R
Action : Dump Profile : “Profiled @ ” + @@SystemCurrentTime
Action – Stop Profile
This action is used to stop profiling. If the Optional parameter ‘File Name’ is passed, then information is also dumped into the file, without requiring the action Dump Profile.
Syntax
Stop Profile [:<File Name>]
Where,
<File Name> is the name of the file to which the information has to be written.
Example
[Button : Stop Profiling]
Key : Alt + T
Action : Stop Profile
Functions Used for Profiling
The following function has been introduced to support profiling:
Function – $$IsProfilerOn
This function is used to check the current status of the TDL Profiler. It returns logical value TRUE, if the status of the profiler is ON.
Syntax
$$IsProfilerOn
Example:
[Function : Switch Profiler OnOff]
10 : If : $$IsProfilerOn
20 : Stop Profile
30 : Else
40 : Start Profile
50 : End If
Profiler Commands
|
Commands |
Description |
|
Start |
Start a new profiling session. |
|
Stop |
Stop data profiling |
|
Reset |
Discard the captured data. |
|
Status |
Check if the profiler is on/off |
|
Dump |
Dump the captured data to a log file excluding TDL artefacts which was executed in less than a millisecond. |
|
Dumpz |
Dump all the captured data irrespective of the time taken to execute. |
|
Open |
Open the last dumped log file within the current instance of Tally.ERP 9/TallyPrime |
|
Detailed |
This command toggles in-depth profiling on/off. By default, the detailed mode is off. When enabled, the profiler will also capture expression evaluations. |