
Ratio Analysis
Ratio Analysis in TallyPrime is a powerful tool for financial analysis, where the analysis of a financial statement is made possible by the use of financial ratios. It helps you compare different sets of financial data. Along with the ratio of your assets with respect to your liabilities, cash in hand, stock in hand, and so on, you can also understand the payment performance of your debtors which indicates the average time the customers take to actually pay their bills irrespective of the outstanding balance on the statement date. All these comparisons and observations give an understanding of the financial position of a business unit.
Ratio Analysis report is mostly sought after by business owners, auditors, and stakeholders who want to have clarity about the course of their business for a particular financial year. By referring to the Ratio Analysis report, they can understand their accounts better and take much informed decisions according to the current fiscal scenario.
In TallyPrime, the Ratio Analysis report consists of Principal Groups and Principal Ratios. The Principal Groups are the key figures that give meaning to the ratios. Principal Ratios compare two pieces of financial data for a meaningful comparison.
You can view Ratio Analysis report in the browser.
View Ratio Analysis Report
![]()
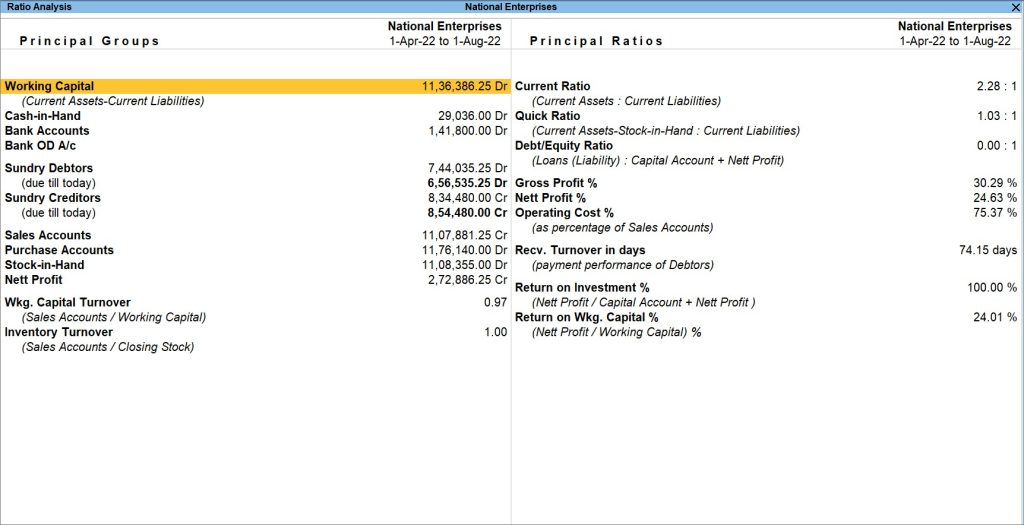
Ratio Analysis in TallyPrime helps you compare different sets of financial data. It consists of Principal Groups and Principal Ratios, that help you know about the overall standing of your business. While Principal Groups showcase your Working Capital, Cash-in-hand, Bank Accounts, along with the data related to Sundry Debtors, Sundry Creditors, Stock-in-hand, Nett Profit, and Inventory Turnover, Principal Ratios display the data related to Current Ratio, Quick Ratio, Gross Profit %, Nett Profit %, Return on Investment %, and more. Apart from the data regarding your current business scenario, TallyPrime allows you to drill down further from the Principal Groups and Ratios to access other primary reports such as Balance Sheet, Profit and Loss A/c, Funds Flow report, and many more. For example, Current Ratio takes you to Balance Sheet and Gross Profit % takes you to Profit & Loss A/c.
- Press Alt+G (Go To) > type or select Ratio Analysis and press Enter.
Alternatively, Gateway of Tally > Ratio Analysis.
A sample image of the Ratio Analysis screen appears, as shown below:
- In case you need to configure the report, press F12 (Configure).
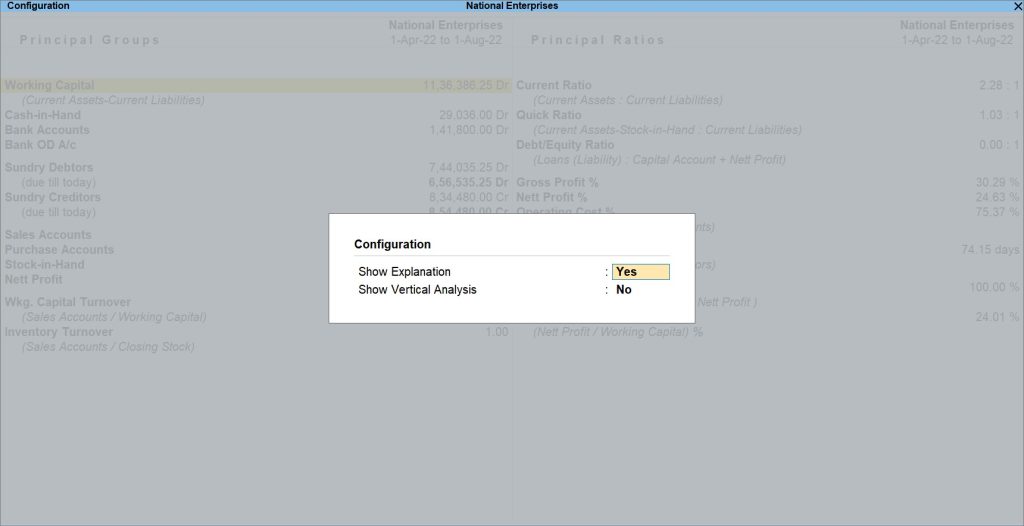
- Show Explanation: No
This option is to disable the description or explanation of the parameters mentioned in the Principal Groups and Principal Ratios. By default, this option is set to Yes. The descriptions are meant to give you a better understanding about the parameters and how they are calculated.
For example, Working Capital is the difference between your Current Assets and Current Liabilities. Similarly, the term Current Ratio depicts the ratio between the Current Assets and Current liabilities and Quick Ratio.

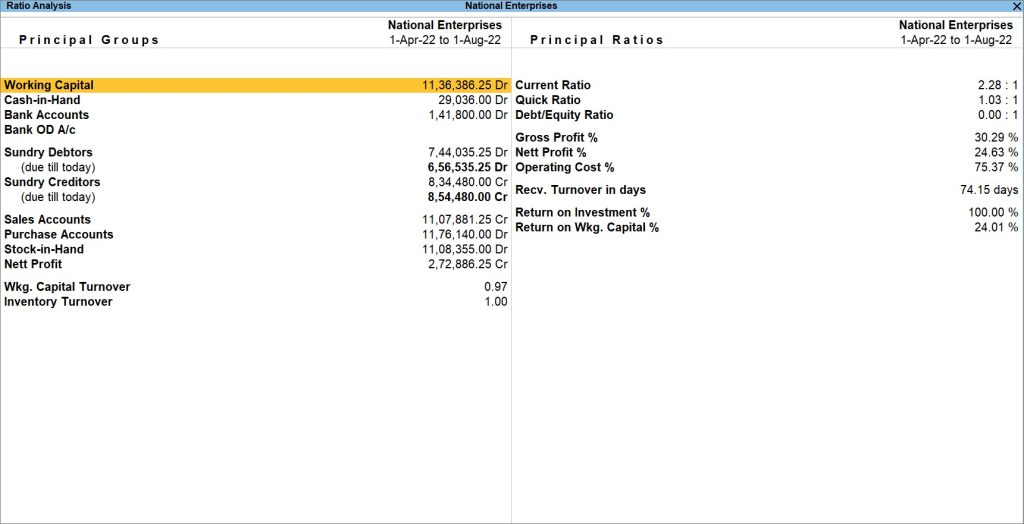
However, you can set this option to either Yes or No, according to your convenience. Once you have set the Show Explanation to No, a sample image of the Ratio Analysis report appears, as shown below:
- Show Vertical Analysis: Yes
This option is to view the Ratio Analysis report vertically. In the Ratio Analysis report, Principal Groups and Principal Ratios appear horizontally by default.
However, if you want to change the view to vertical and represent the data vertically, you can do so by changing this option to Yes.
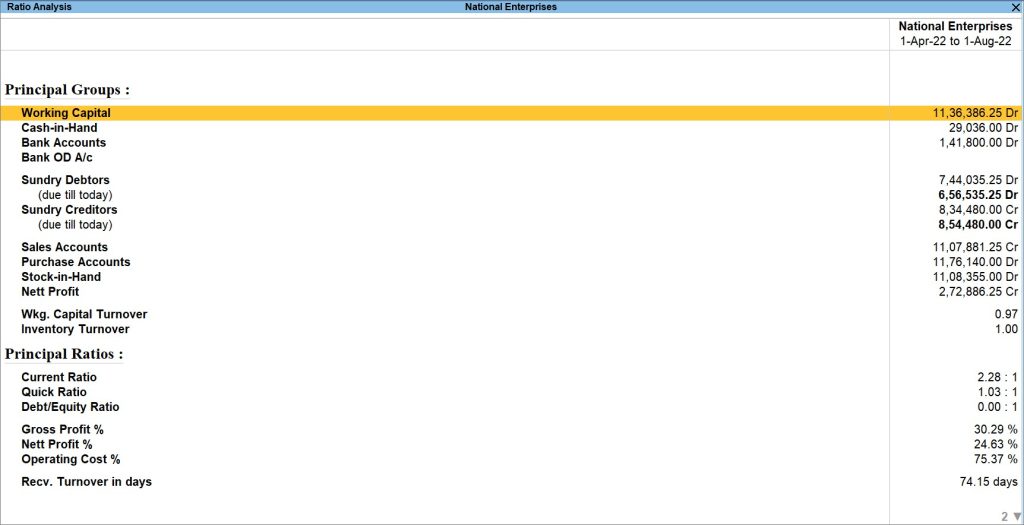
Once you have set the Show Vertical Analysis to Yes, you can view the Ratio Analysis report, as shown below:
- Show Explanation: No
Principal Groups
The following are the key features that summarize the Principal Groups in the Ratio Analysis report.
- Working Capital: The Working Capital is calculated by subtracting Current Liabilities from Current Assets. Financial analysts often consider the total Current Assets as the Working Capital. This serves as a measure of how far the firm is protected from liquidity problems.
- Cash-in-Hand and Bank Accounts: This data provides another view of the liquidity position where you can get the details of the finances.
- Bank OD A/c: It allows the account holder to continue withdrawing money even when the account has no funds in it or has insufficient funds to cover the amount of the withdrawal. Basically, if you have a bank OD account, you can borrow a set amount of money from the bank.
- Sundry Debtors (due till today): This is the list of all the debtors and total debts due as of the date of the statement.
- Sundry Creditors (due till today): This is the list of all the creditors and total credits due as of the date of the statement.
- Sales and Purchase Accounts: The Sales and Purchase Accounts, which represent the trading activity for the period, are displayed.
- Stock-in-Hand: The Stock-in-Hand is displayed as on the date of the report. Together with Cash and Bank Balances and Debtors, this completes the Current Assets aspect of the Working Capital.
- Nett Profit: This is derived from the Profit & Loss Account, and is the profit that remains after direct and indirect expenses.
- Wkg. Capital Turnover (Sales Accounts/Working Capital): This is an activity or efficiency ratio that shows the number of times the working capital has been rolled over during a particular period. It depicts how effectively the firm is using its working capital.
- Inventory Turnover (Sales Accounts/Closing Stock): This is an activity or efficiency ratio that shows the number of times the stock has been rolled over during the report period. It depicts how effectively the firm is using its inventories.
Principal Ratios
The following are the key features that summarize the Principal Ratios in the Ratio Analysis report.
- Current Ratio: It is the ratio between the Current Assets and Current liabilities. The current ratio helps you to understand whether your business is able to pay the liabilities with its current assets.
- Quick Ratio: This ratio displays the difference between your Current Assets and Stock-in-Hand with respect to your Current Liabilities. Quick Ratio indicates the company’s ability to instantly use its near-cash assets, which can be converted quickly to cash, to pay down its current liabilities without considering stock in hand.
- Debt/Equity Ratio: This ratio tells you how much debt you have taken as compared to the company’s equity. A high Debt equity ratio means that your company relies on debt financing.
- Gross Profit %: It is the profit made from the sale of goods and services, expressed in percentage. It is the difference between revenue and cost of goods sold, divided by revenue. Gross Profit % reflects your business efficiency.
- Nett Profit %: The percentage of earnings remains with you after all the operating and non-operating expenses are deducted from the gross profit. Nett Profit % demonstrates how well you handle your indirect expenses.
- Operating Cost %: It is the percentage of operating cost with respect to the total turnover. Operating Cost % helps you check certain areas of your business, such as cost control and cost reduction.
- Recv. Turnover in days: Through this data, you can analyze your debtor-wise payment performance. Identifying the customers who are yet to pay their bills, you can plan the receivables collection process through Recv. Turnover in days.
- Return on Investment %: It is used to evaluate the efficiency of an investment or different investments. Return on Investment percentage is the benefit drawn from an investment or Nett Profit with respect to your Capital Account and Nett Profit combined together. Expressed in percentage, Return on Investment directly measures the amount of return on a particular investment, with respect to the cost incurred on the investment.
- Return on Wkg. Capital %: It is the ratio of Nett Profit with respect to Working Capital. Return on Working Capital percentage highlights the relation between the investments done towards the operation of a business and the revenues it generates to continue its operation and make profit.
Payment Performance of Debtors
![]()
Payment Performance of Debtors (Receivable Turnover in days) is the average time the customers take to pay their bills, irrespective of the outstanding balance on the statement date. It is possible that the receivable turnover is low and the payment performance is high, indicating that the customers cleared their outstanding, but took a long time to do it.
To get group-level and customer-level performance reports and a detailed position of debt collection, you have to drill down from the ratios. Use a customer statement that shows both the receivable turnover in days and the customer’s actual payment performance.
- In the Ratio Analysis report, select Recv. Turnover in days, and press Enter.
If your company has groups, you can see the Group Payment Performance screen, as shown below:
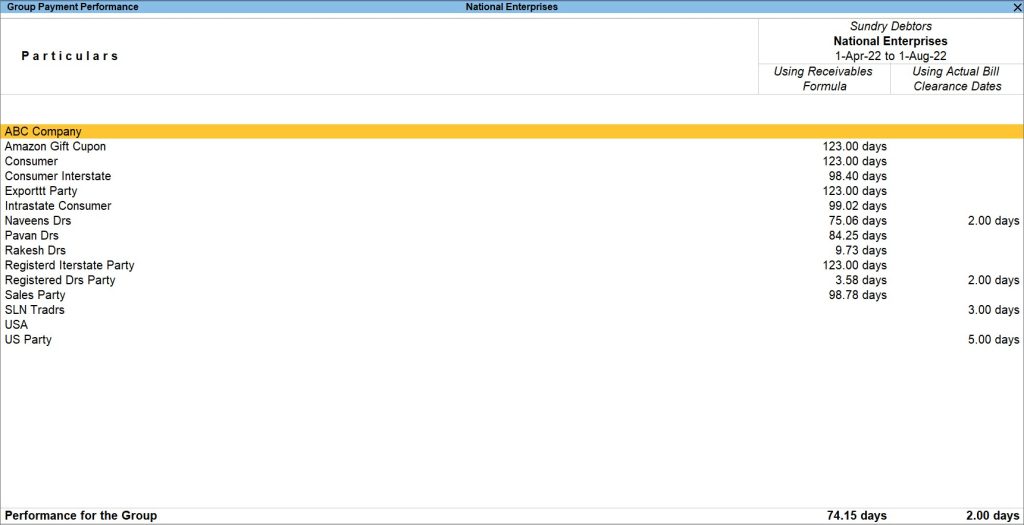
- Drill down from the required group to view the performance of the party in the Ledger Payment Performance screen.
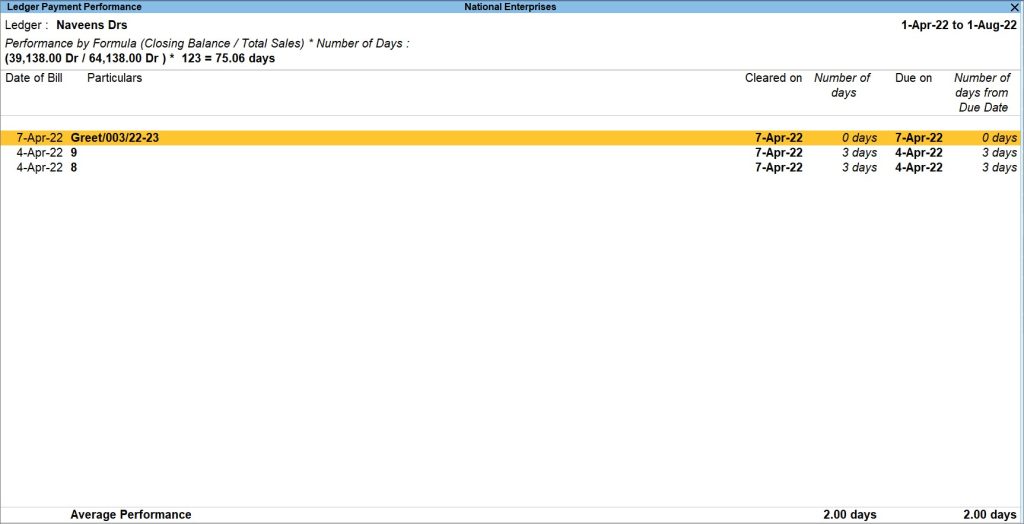
- Press Enter for more details of the selected party.
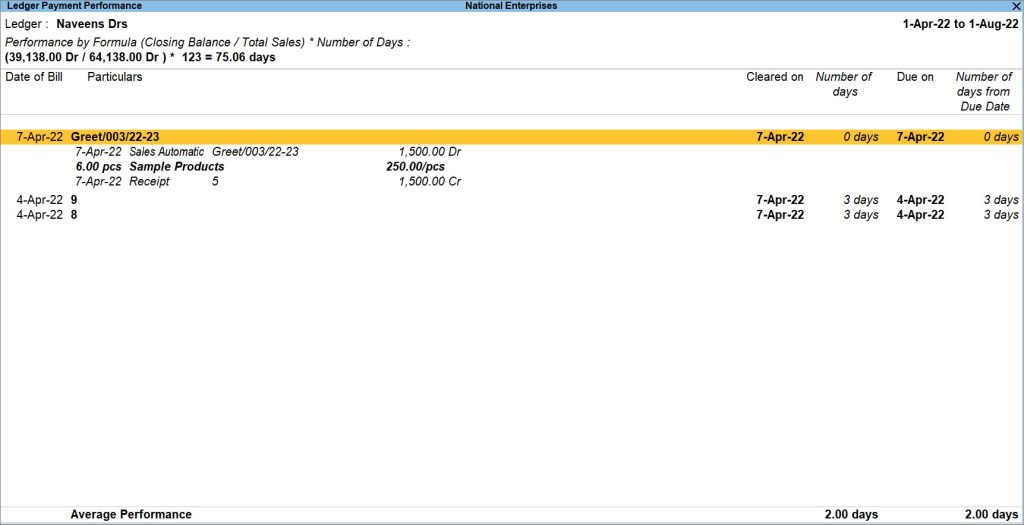
The Ledger Payment Performance statement displays the receivable turnover in days. This is the balance outstanding in relation to the total sales made, multiplied by the total number of days in the period. This ratio should be used in combination with the Average Performance of actual payments and the payment history of the customer to assess how long they might take to pay the outstanding balance.
The actual payment history is given in the table for each invoice that was paid by the customer. It shows when the invoice was paid, how long it was due, and what was the delay in payment. The customer’s average performance is shown at the bottom of the screen.
The Ratio Analysis report gives you insights into the profitability, liquidity, operational efficiency, and financial stability of your business. It tells you how your business has been performing for a particular period and guides you to take convenient decisions.

