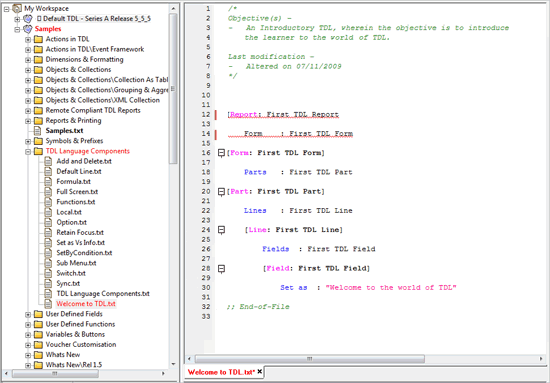
Syntax errors in the code are colored in r ed .

In the above code snippet, definition type Report is wrongly spelt as Repor . Hence, it has been underlined in Red, thus making it easier for the programmer to debug the code. Also, the definition Menu has an opening square bracket, but the closing square bracket is missing. Hence, it has also been underlined in red .
By right-clicking on the error location, the option Explain this Error can be seen in the pop-up menu, clicking on which shows the explanation of the error in the Search Tab of the Output Window.

The name of the file containing syntax errors is displayed in Red colour in the corresponding Tab.
On right-clicking on the particular Tab, an option ' Go to Error " is displayed. On selecting it, the focus moves on to the first error in the file. Thus, it helps the programmer to debug the program easily.
In addition to identifying errors using Tabbed View, when a file with error is identified, the particular file name, folder name and the project name are displayed in Red text in the Project Browser. Thus, at a glance, the user will be able to tell whether an error exists within a file/project. This feature can be disabled by unchecking “Show Errors in Project Browser” in Tools > Preferences > Explorer Options. By default, Tally.Developer9 will highlight the errors till the project level.
Apart form this, the lines in the code containing error can be identified by red colour vertical lines on the left hand side of the Editor window, as seen above.